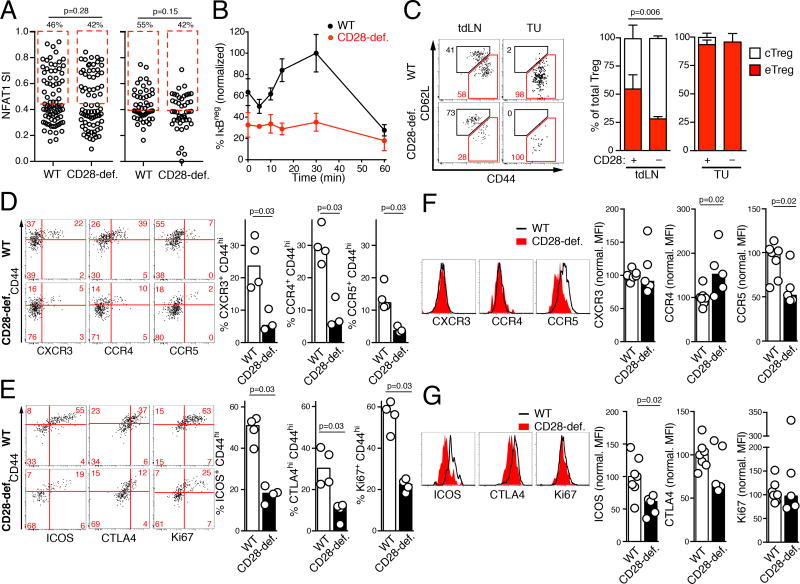
Figure 6. CD28 optimizes the differentiation of tumor-infiltrating eTreg.
(A) Ex vivo analysis of NFAT1 and NFAT2 nuclear localization in control or CD28-deficient Foxp3+ Treg immediately upon isolation from LNs and spleen of CD28 ΔTreg or Foxp3YFP-Cre control mice and processed as described for Fig. 5A. One experiment out of two is shown, p-values calculated through Mann-Whitney U test. (B) Analysis of IκB down-regulation in YFP+ Treg from CD28 ΔTreghet and Foxp3YFP-Cre/wt control mice. Mean and SD of normalized average of triplicate measures are shown. One experiment representative of two is shown. (C) Frequencies of CD44low CD62Lhi cTreg and CD44hi CD62Lneg eTreg among total YFP+ Treg in tdLNs in CD28 ΔTreghet or Foxp3YFP-Cre/wt control mice. Means and SEM of one experiment (4 mice per group) out of 3 is shown. (D, E) Expression of CXCR3, CCR4 and CCR5 (D) and ICOS, CTLA-4 and Ki67 (E) in YFP+ Treg in tdLNs of CD28 ΔTreghet (‘CD28-def.’) and Foxp3YFP-Cre/wt control mice (‘WT’) 11 days after MCA-205 tumor implantation. In both (D) and (E) quantification of one experiment (n=3–4) representative of 3 performed is shown. Bars represent medians, p-values calculated by Mann-Whitney U test. (F, G) Expression of CXCR3, CCR4 and CCR5 (F) and ICOS, CTLA-4 and Ki67 expression (G) in tumor tissue of CD28 ΔTreghet (‘CD28-def’) and Foxp3YFP-Cre/wt control (‘WT’) mice 11 days after MCA-205 tumor implantation. Data are pooled from 3 independent experiments (n=5–7). MFIs were normalized to the average MFI of WT Treg within each experiment, p-values calculated by Mann-Whitney U test.

