
Fig. 1.
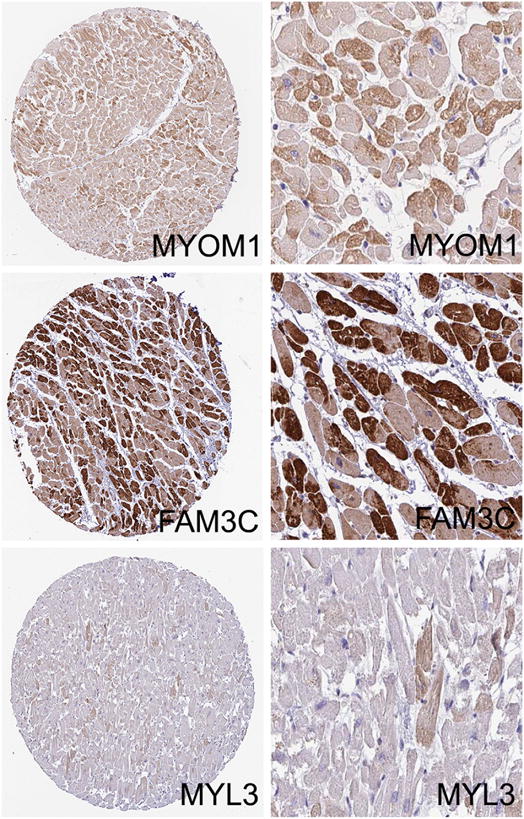
Representative images of mosaic patterns of protein expression as detected by HPASubC. The staining patterns of three proteins MYOM1, FAM3C and MYL3 are shown as the entire TMA core and as a higher power view. Mosaic staining could be subtle as seen in MYL3. All images are from the Human Protein Atlas [19].