Fig. 5.

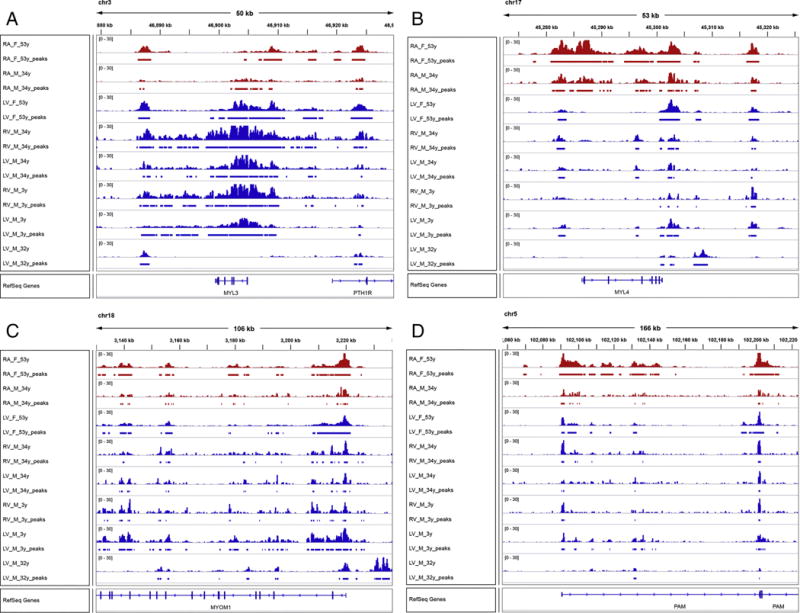
Histone modification data. Colored peaks represent regions of enhanced H3K27ac signal signifying open chromatin. The top two red rows are right atria and the bottom 6 rows are ventricle samples. Peak heights are normalized to 30.

Histone modification data. Colored peaks represent regions of enhanced H3K27ac signal signifying open chromatin. The top two red rows are right atria and the bottom 6 rows are ventricle samples. Peak heights are normalized to 30.