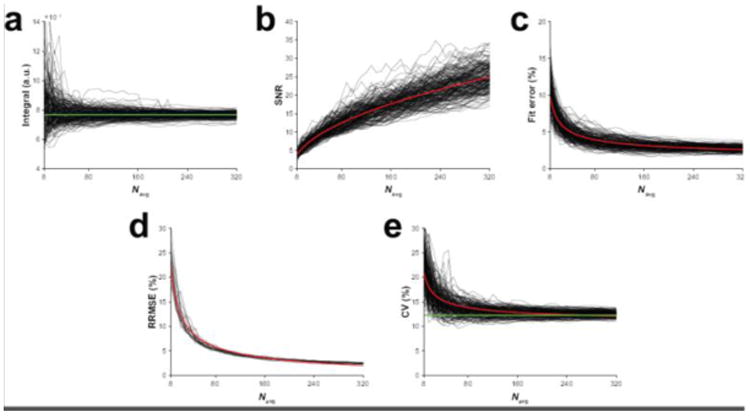
Figure 2.

Results from the simulations. (a) The modeled GABA signal integral, (b) GABA SNR and (c) GABA model fit error as a function of the number of cumulatively binned signal averages for one example simulated GABA-edited MEGA-PRESS dataset. The output from each of the 200 repeated simulations is displayed. (d) RRMSEs as a function of the number of cumulatively binned signal averages for the 20 simulated datasets. (e) The group-level CV of the dataset cohort as a function of the number of cumulatively binned signal averages in each of the 200 repeated simulations. The red lines in (b–e) are the modeled relationships of SNR, model fit error, RRMSE and CV as a function of the number of signal averages according to square-root and inverse-square-root functions. The green lines in (a) and (e) indicate the true integral of the example dataset and the CV of the 20 datasets, respectively.
