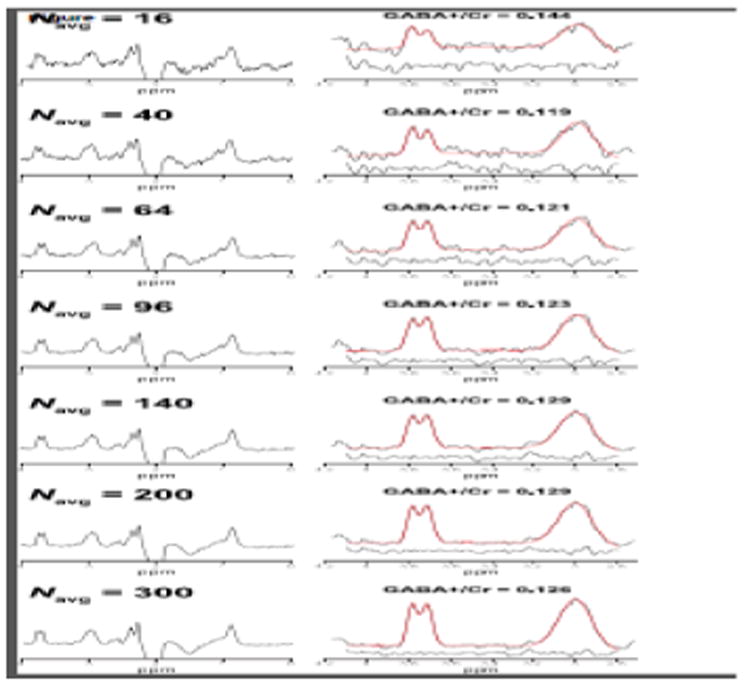
Figure 3.

Example GABA-edited DIFF spectra from one in vivo dataset acquired from an OCC voxel. Each spectrum represents the data binned into 16, 40, 64, 96, 140, 200 and 300 signal averages. The right column shows the edited GABA+ and Glx signals with the corresponding three-Gaussian model fits overlaid in red. Fit residuals are shown below the fitted data.
