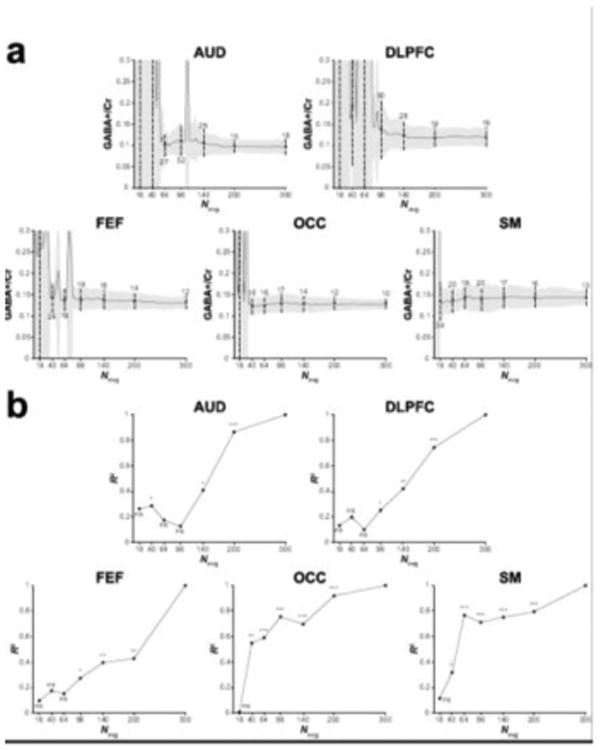
Figure 4.

(a) Group GABA+/Cr measurements for the five voxels displayed as a function of the number of cumulatively binned signal averages. The solid black lines show the mean across the group. The grey shaded area is the corresponding standard deviation. The dots and black lines show the mean and standard deviation for the data containing 16, 40, 64, 96, 140, 200 and 300 signal averages. The associated CV is shown as a percentage above or below the dashed lines. (b) R2 values from the correlational analyses of the GABA+/Cr data for the five voxels. Participants' GABA+/Cr data containing 16, 40, 64, 96, 140 and 200 signal averages were correlated against the data containing 300 signal averages. *** p < 0.001, ** p < 0.01, * p < 0.05, ns = non-significant.
