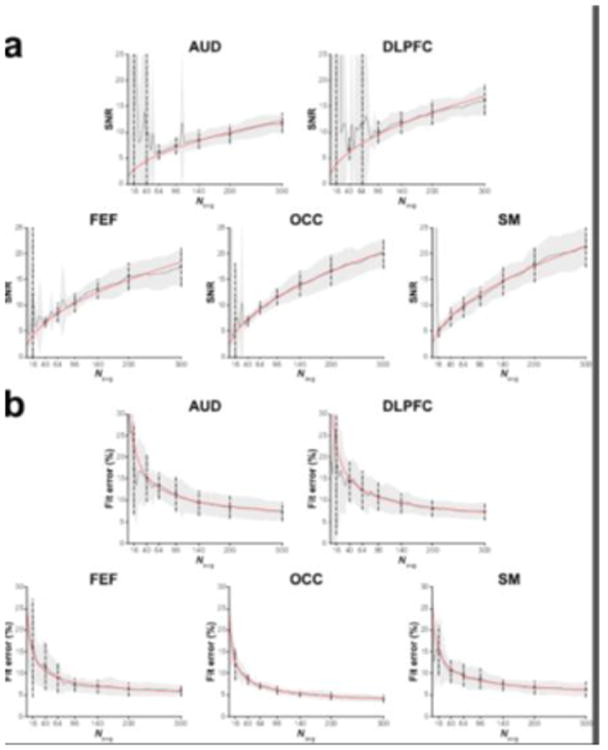
Figure 5.

(a) Group GABA SNR values and (b) GABA model fit errors for the five voxels displayed as a function of the number of cumulatively binned signal averages. The solid black lines show the mean across the group. The grey shaded area is the corresponding standard deviation. The dots and dashed lines show the mean and standard deviation for the data containing 16, 40, 64, 96, 140, 200 and 300 signal averages. The red lines represent either the corresponding square-root (in a) or inverse-square-root (in b) model of the data.
