
Figure 6.
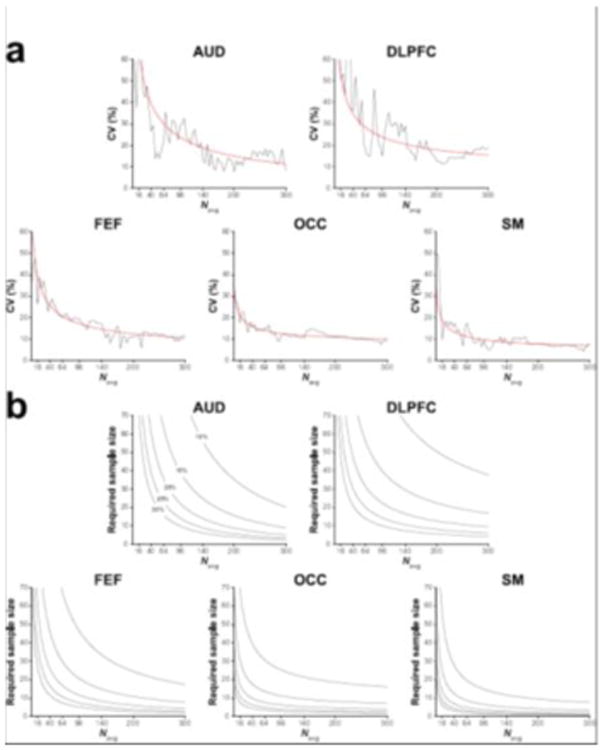
(a) Group-level CV of GABA+/Cr for the five voxels displayed as a function of the number of cumulatively binned signal averages. The red lines represent the corresponding inverse-square-root model of the data. (b) Estimated sample sizes (per group) required for a statistical comparison of two groups given various predicted effect sizes (differences of 10–30% in GABA+/Cr) displayed as a function of the number of signal averages. Statistical power = 80%; alpha level = 0.05.