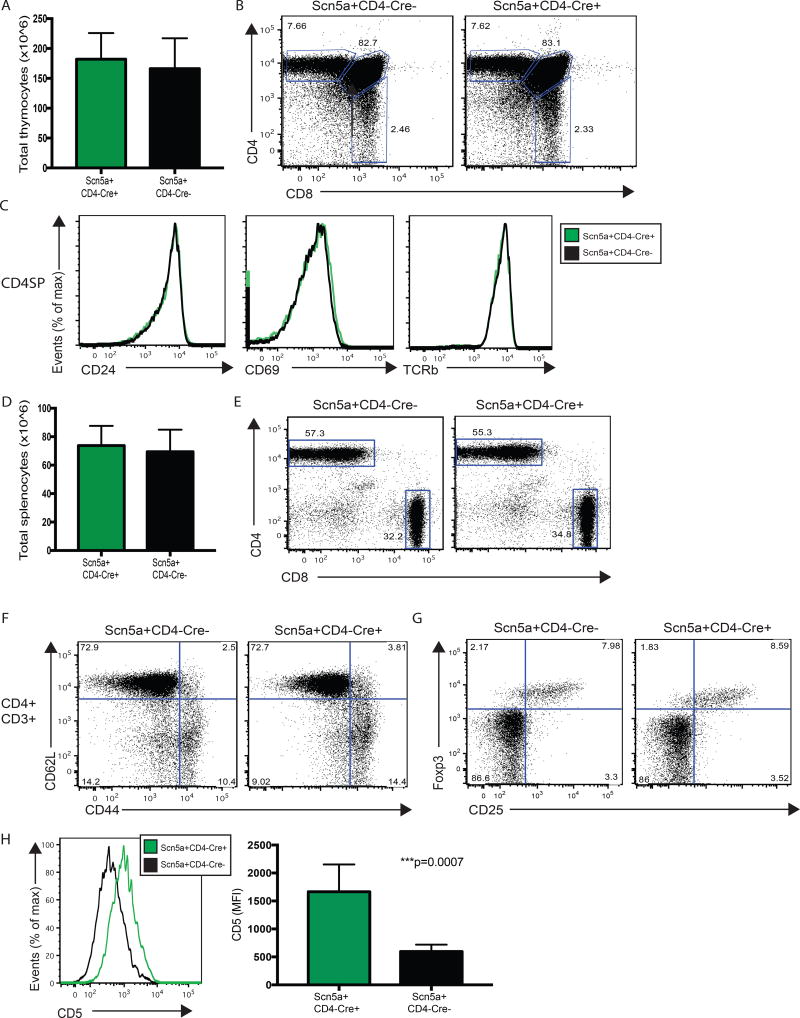
Figure 2. T cell development and phenotype is comparable in Scn5a+CD4-Cre+ mice and their Scn5a+CD4-Cre- littermates, except for CD5 expression.
(A) Whole thymus was isolated from 6–8 week old Scn5a+CD4-Cre+ mice (n=5) and Scn5a+CD4-Cre- littermates (n=5). Thymii were processed into single cell suspensions to determine whole thymocyte counts. (B) Single cell thymocyte suspensions from Scn5a+CD4-Cre+ mice and Scn5a+CD4-Cre- littermates were analyzed by FACS to assess thymocyte development. Live/dead gating was followed by doublet discrimination before CD4 and CD8 levels were compared. (C) The CD4+CD8- (CD4 SP) population was assessed for expression levels of CD24, CD69 and TCRβ. (D) Whole spleen was isolated from 6–8 week old Scn5a+CD4-Cre+ mice (n=12) and Scn5a+CD4-Cre- littermates (n=10). Spleens were processed into single cell suspensions and red blood cells were lysed to determine whole splenocyte counts. (E) Single cell splenocyte suspensions from Scn5a+CD4-Cre+ mice and Scn5a+CD4-Cre- littermates were analyzed by FACS to assess the peripheral T cell compartment. Live dead/gating was followed by doublet discrimination. CD3+ cells were then analyzed for CD8+ and CD4+ populations. (F) Within the CD3+CD4+ T cell compartment, antigen experience was assessed using CD44 and CD62L staining. (G) Within the CD3+CD4+ T cell compartment, the presence of Tregs was assessed using Foxp3 and CD25 staining. (H) Within the CD3+CD4+ T cell compartment, CD5 levels were analyzed and compared, using mean fluorescence intensity (MFI).

