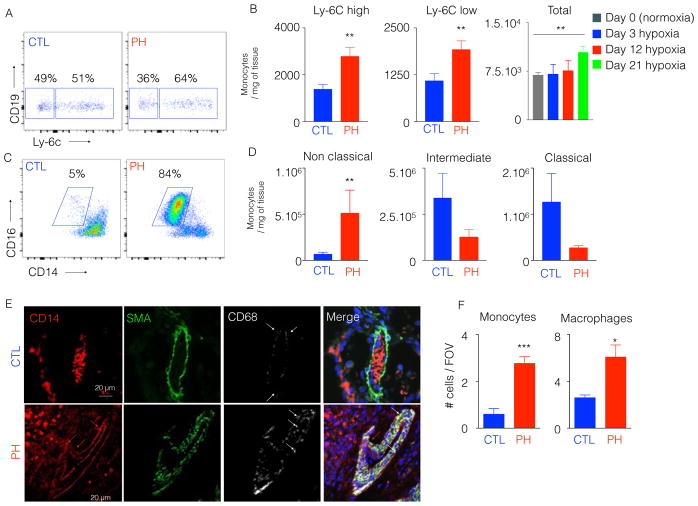
Figure 2. The number of inflammatory lung monocytes is elevated in hypoxic mice and PAH patients.
C57BL/6 mice were placed in a 10% O2 hypoxic chamber (n=4 normoxic controls and 6 hypoxic mice) for three weeks to induce PH. A) Flow cytometric plots showing the proportion of Ly-6Chigh and Ly-6Clow monocytes in hypoxic and normoxic mouse lung samples. B) Quantitation of Ly-6Chigh and Ly-6Clow monocytes at 21 days, and total monocytes at various timepoints after hypoxia initiation C) PAH patient lung samples (n=6) or control lung samples (n=5) were collected. Flow cytometric plots showing the proportion of lung non-classical monocytes in control (CTL) and PAH patients. D) Quantitation of classical, intermediate and non-classical monocytes in CTL and PAH lung samples. E) Confocal imaging of patient lung sections stained for CD68, SMA and CD14. F) Quantification of monocytes and macrophages in CTL and PAH lung samples. Mean ± s.e.m. ** P < 0.01.

