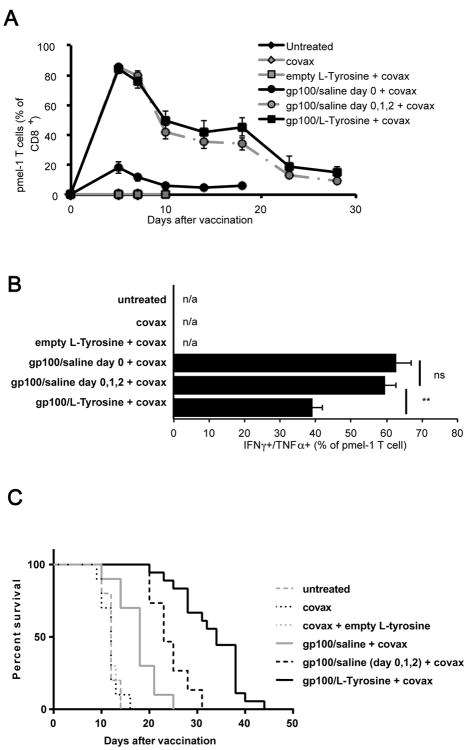
Figure 6.
Anti-tumor efficacy of different vaccine formulations regimens. Mice received 8×10⁵ pmel-1 T cells and indicated treatments on day 0. A) Pmel-1 T cell response after different vaccine formulations were followed and B) their function at day 7 post vaccination was shown (mean ± s.e.m.). C) Anti-tumor efficacy of corresponding groups of the same experiment. n = 10 – 20 mice/group. Peptide dose was 50ug per mice. Data pooled from 2 independent experiments. Differences in survival among groups were compared using log-rank test. *: P< 0.05, **: P< 0.01, ns: not significant, n/a: not available.

