
Figure 3. 12/15LOX-/- deletion polarized neutrophils towards proresolving phenotype.
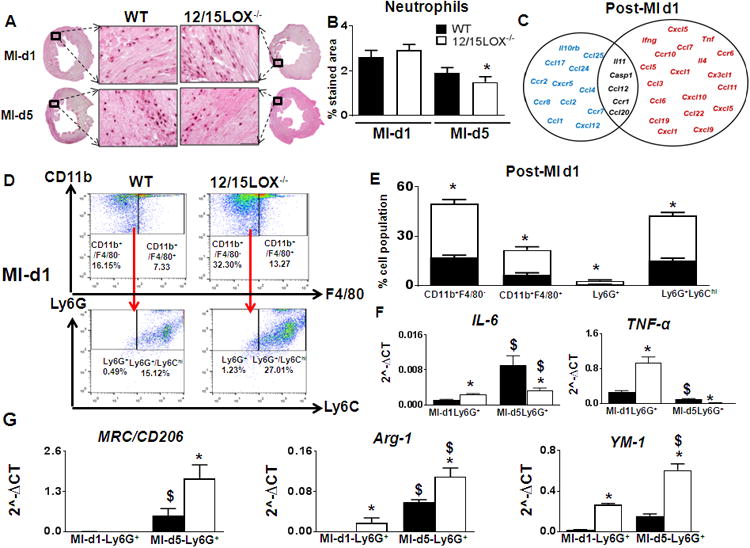
(A) Representative neutrophil-stained LV images at 40× with their accompanying 1.25× sections at d1, and d5 post-MI; scale bar = 50 μm n=4. (B) Quantification of the neutrophils stained area in the LV at post-MI d1 and d5. n=4; *p<0.05 vs WT. (C) Venn diagram representing post-MI inflammatory gene expression in LVI regions of 12/15LOX-/- mice at post-MI-d1. Post-MI-d1 gene expressions are normalized to respective no-MI. Red indicates ↑ed genes. Blue indicates ↓ed genes. Black indicates no change in genes. n=4; p<0.05 vs WT post-MI-d1. (D) Representative fluorescence-activated cell (FACS) sorting dot plots showing increased neutrophils by Ly6Ghigh strategy in LV mononuclear cells n=4-6 mice. (E) Quantification of CD11b+/F4/80-, CD11b+/F4/80+, Ly6G+ and Ly6G+/Ly6Chigh LV mononuclear cells post-MI-d1. n=4-6 mice; *p<0.05 vs WT. (F) mRNA expression of IL-6, tnf-α, from Ly6G+(N1) cells isolated from LV infarct. n=4mice; *p<0.05 vs WT $p<0.05 vs WT at d1 post-MI. (G) mRNA expression of Mrc-1/CD206, Arg-1 and Ym-1 from Ly6G+(N2) cells isolated from LV infarct. n=4-6 mice; *p<0.05 vs WT control, $p<0.05 vs WT at d1 post-MI.