
Figure 5. Macrophages derived HO-1 promoted effective resolution of inflammation in 12/15LOX-/- mice.
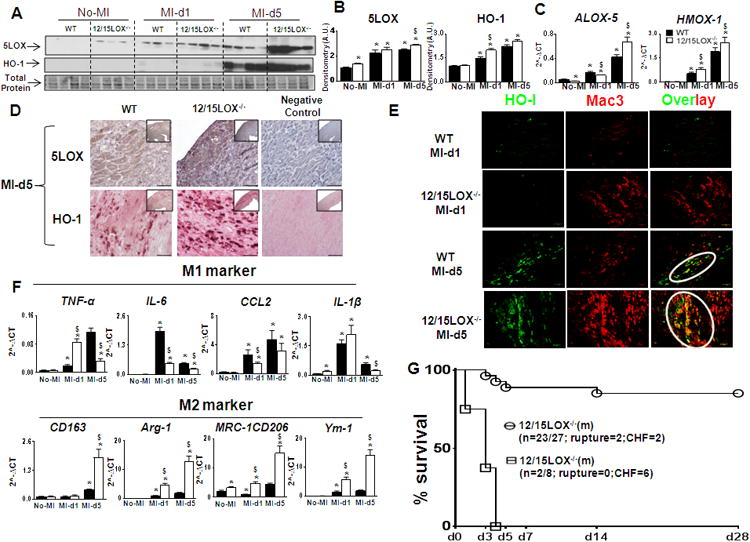
(A) Immunoblot representing 5-LOX and HO-1 expression in LVI. (B) Densitometric analysis showing increase 5LOX and HO-1; n=3 mice for no-MI; n=4 mice post-MI; *p<0.05 vs no-MI, $p<0.05 vs MI-WT at respective day. (C) mRNA expression of Alox-5 and Hmox-1 in LVI. n=4 mice; *p<0.05 vs No-MI, $p<0.05vs MI-WT at respective day. (D) Representative LV IHC images showing 5LOX and HO-1 expression at d5 post-MI. (E) Representative immunofluorescence co-localization images (yellow) of HO-1 (green) with Mac-3 (red) (Magnification 10×). (F) Gene expression of M1 and M2 markers. n=4 mice; *p<0.05 vs no-MI, $p<0.05vs MI-WT at respective day. (G) Survival curve presenting HO-1 inhibitor (tin protoporphyrin IX) increased mortality in 12/15LOX-/- mice bylog-lank test *p<0.01.