
Figure 8.
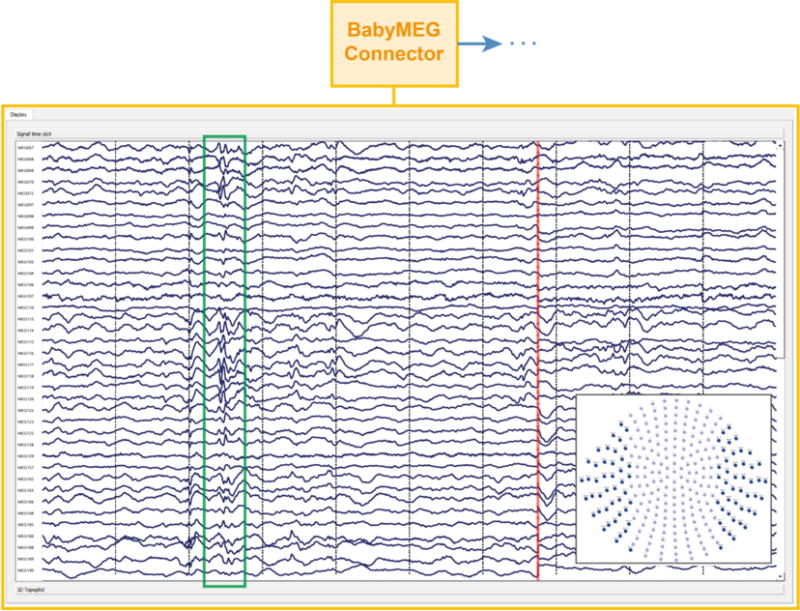
The FDA approved main MNE Scan application and BabyMEG plug-in. The snapshot shows the real-time visualization of the incoming data stream of left and right temporal MEG channels during a clinical epilepsy study. The epileptic activity is marked by the green rectangle. The end of the last received data block is indicated by the red vertical line. Further connection of algorithm plug-ins is implied by the dots next to the arrow in the upper part of the figure.