
Figure 9.
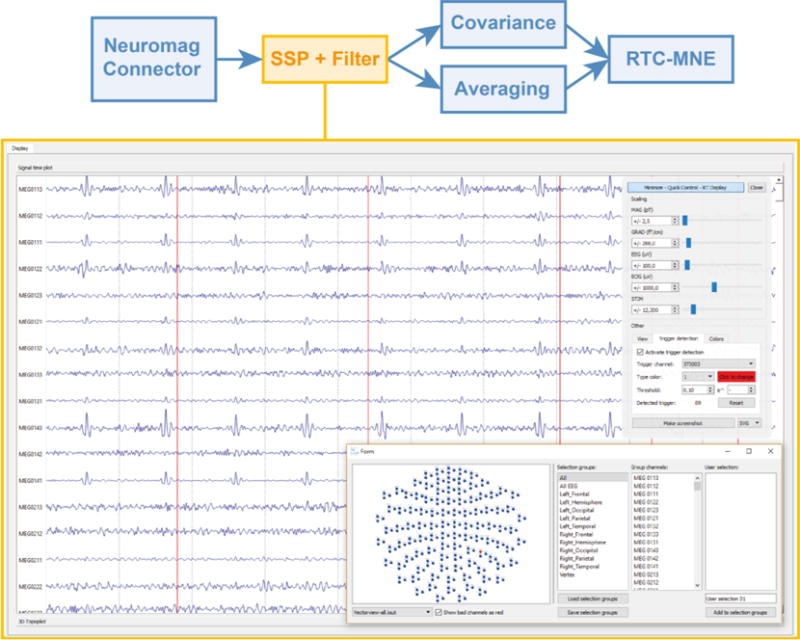
Real-time visualization of the data stream after it was received from the Neuromag plug-in and processed in the SSP and temporal filter plug-ins. The vertical red lines indicate the detected triggers for each auditory stimulus. The quick control widget and selection manager are shown in the upper and lower right part of the figure, respectively. Subsequently, the data stream is forwarded to the covariance and averaging plug-ins, which run in parallel to each other.