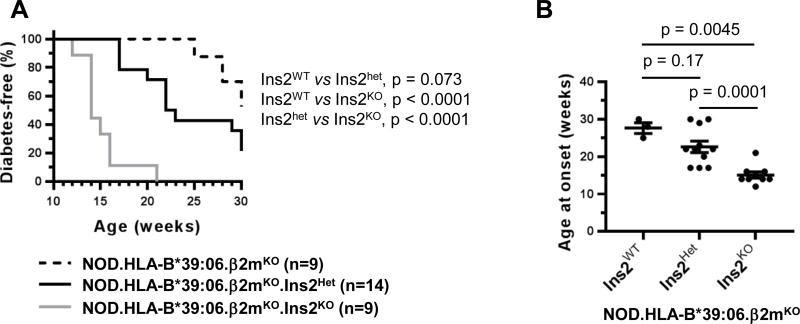
Figure 5. HLA-B*39:06Hom mice display increased diabetes development in the context of reduced thymic insulin expression.
(A) The results of diabetes incidence studies performed at Albert Einstein College of Medicine using female NOD.HLA-B*39:06Hom.β2mKO mice (n = 9) and their Ins2Het (n = 14) and Ins2KO (n = 9) counterparts are shown; p values are indicated (Mantel-Cox). (B) The ages at onset for all mice in (A) that became diabetic during the incidence study are plotted. Each circle represents an individual mouse. Lines denote mean ± SEM; p values are indicated (Mann-Whitney). Ins2WT, n = 3; Ins2Het, n = 11; Ins2KO, n = 9.

