Figure 1.

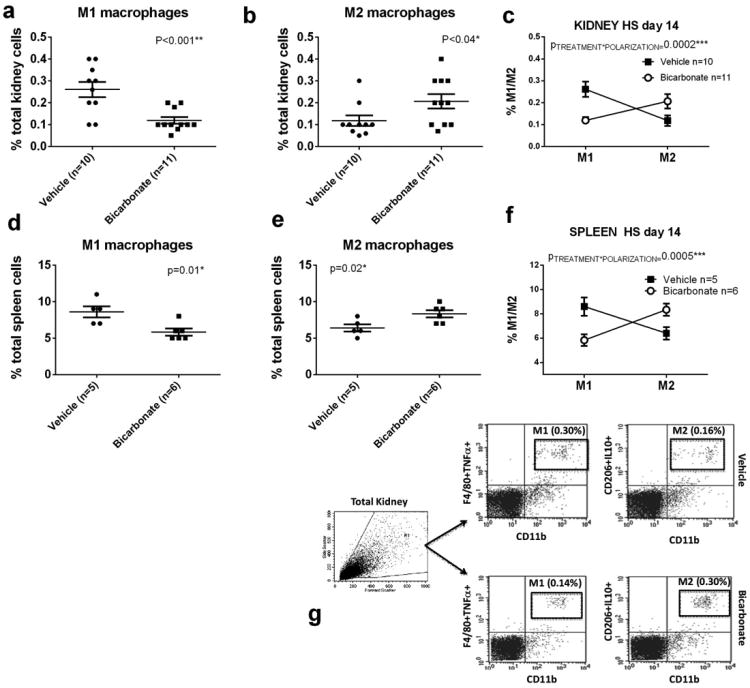
Data from flow cytometric analysis of macrophage polarization (M1/M2) from kidneys and spleen from male Dahl SS rats drinking 0.1M NaHCO3 (bicarbonate) or equimolar NaCl (vehicle) are presented in figure 1a-g. All data are from rats placed on treated water (vehicle or bicarbonate) for 3 days before being switched to a HS diet for 14 days prior to tissue harvest.
Panel a; the percentage of total kidney cells identified as M1 macrophages(CD11b/Figure 4/80+/TNFα+ cells) in vehicle (n=10; filled circles) and bicarbonate (n=11; filled squares) treated rats.
Panel b; the percentage of total kidney cells identified as M2 macrophages (CD11b/CD206+/IL10+ cells) in vehicle (n=10; filled circles) and bicarbonate (n=11; filled squares) treated rats.
Panel c; Relative expression of M1 and M2 macrophages expressed as a % of total kidney cells in vehicle (filled squares) and bicarbonate (open circles) treated rats. Panel d; the percentage of total spleen cells identified as M1 macrophages (CD11b/Figure 4/80+/TNFα+ cells) in vehicle (n=10; filled circles) and bicarbonate (n=11; filled squares) treated rats.
Panel e; the percentage of total spleen cells identified as M2 macrophages (CD11b/CD206+/IL10+ cells) in vehicle (n=10; filled circles) and bicarbonate (n=11; filled squares) treated rats.
Panel f; Relative expression of M1 and M2 macrophages expressed as % of total spleen cells in vehicle (filled squares) and bicarbonate (open circles) treated rats.
Panel g; representative gating images from kidney of HS treated rats
