Figure 3.
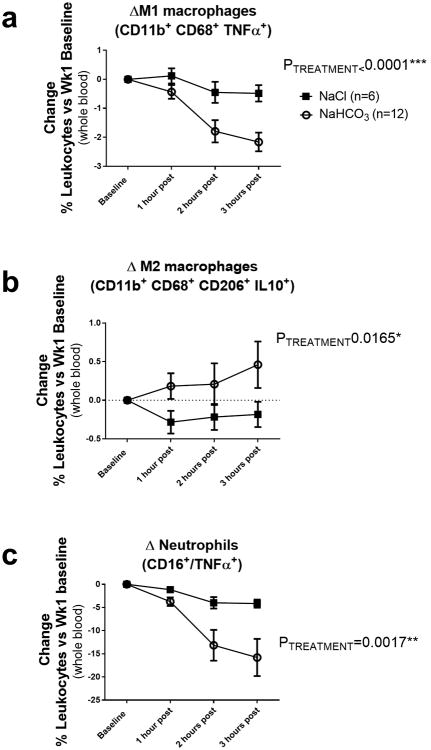
Data from flow cytometric analysis of human blood from subjects drinking either NaHCO3 (bicarbonate) or equimolar NaCl (vehicle) are presented in figure 7a-c. Y axis, all data are expressed as change in % of total blood leukocytes compared to baseline values taken prior to any treatment. Baseline data for all subjects is given in Table 2. X axis, 1 hour post = data obtained 1 hour after ingesting 2g or NaHCO3 (n=12 subjects) or equimolar NaCl (n=6 subjects) solution in 250mL of bottled water. 2 hours post, data obtained 2 hours after ingesting 2g or NaHCO3 or equimolar NaCl solution in 250mL of bottled water. 3 hours post = data obtained 3 hours after ingesting 2g or NaHCO3 or equimolar NaCl solution in 250mL of bottled water (note not all subjects had blood drawn at 3 hours (n=10 for NaHCO3 at 3 hours in supplement). All data are mean±SE. PTREATMENT = the output of a 2-way ANOVA comparing treatment groups. P<0.05 was considered significant.
Panel a; the change in percentage of total blood leukocytes identified as M1 macrophages (CD11b+/CD68+/TNFα+ cells) in vehicle (n=6; filled squares) and bicarbonate (n=12; open circles) treated subjects as compared to baseline.
Panel b; the change in the percentage of total blood leukocytes identified as M2 macrophages (CD11b+, CD68+, CD206+ and IL-10+ cells) in vehicle (n=6; filled squares) and bicarbonate (n=12; open circles) treated subjects as compared to baseline.
Panel c; the change in the percentage of total blood leukocytes identified as TNFα+ neutrophils (CD16+/TNFα+ cells) in vehicle (n=6; filled squares) and bicarbonate (n=12; open circles) treated subjects as compared to baseline.

