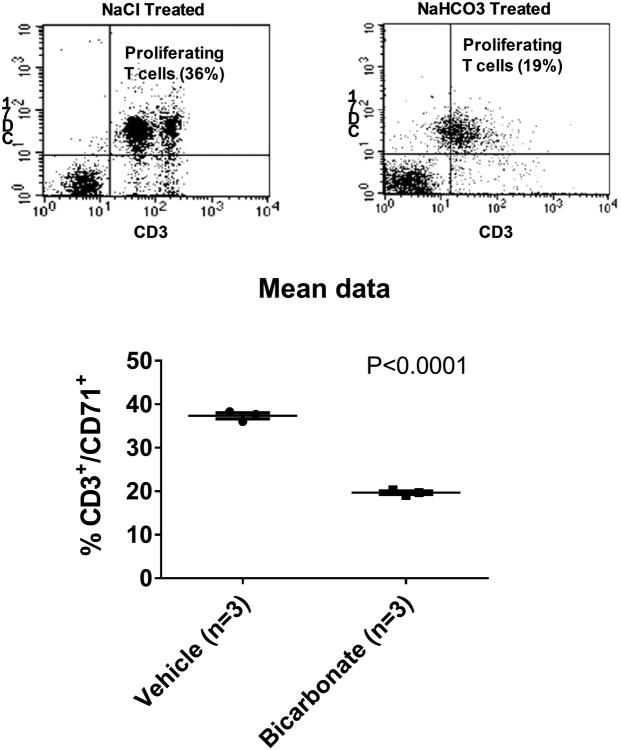
Figure 5.
Mixed lymphocyte reaction. (Top) Representative flow cytometry dotplots depict cellular proliferation of T cells after 96 hours of incubation with mixed splenocytes from animals either treated with oral Nacl (Left: 0.1M for 3 days) or NaHCO3 (Right; 0.1M for 3 days). X axis CD71+ cells. Y axis CD3+ cells. Mean data ± SE as well as individual animal data (circles; n=3 for each treatment group), are shown in the lower panel. P = result of unpaired t-test.

