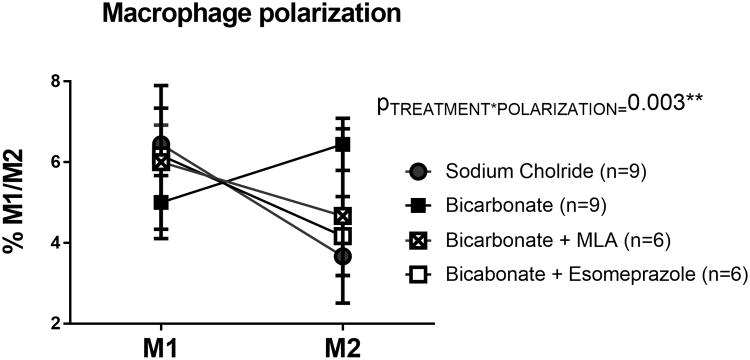
Figure 6.
Data from flow cytometric analysis of macrophage polarization (M1/M2) from spleens of male Sprague Dawley rats drinking either 0.1M NaHCO3 (bicarbonate; filled squares; n=9) or equimolar NaCl (vehicle; filled circles; n=9) or bicarbonate with inhibition with methyllycaconitine (MLA: 5mg/kg; Sigma; bicarbonate + MLA; crossed squares; n=6) and bicarbonate + esomeprazole (20mg/kg; Sigma; empty squares; n=6). All data are from rats placed on treated water (vehicle or bicarbonate) for 3 days. Y axis, the percentage of total kidney cells identified as M1 macrophages (CD68+/CD163+/CD206-/TNFα+ cells) and M2 macrophages (CD68+/CD163+/CD206+/IL-10+ cells). PTREATMENT*POLARIZATION = the output of a 2-way ANOVA comparing all treatment groups. P<0.05 was considered significant.

