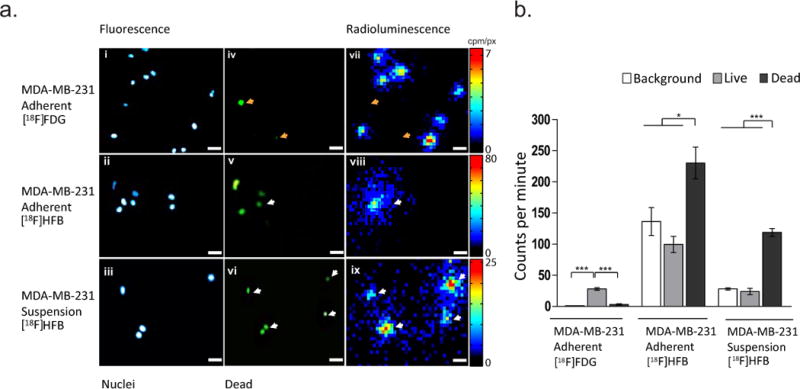
Fig. 3. Dual fluorescence and radioluminescence microscopy reveals an unexpected binding pattern for [18F]HFB.

(a) i-ii Representative fluorescence images of adherent and (a) iii suspension MDA-MB-231 nuclei. (a) iv-vi Localisation of dead cell nuclei. (a) vii-ix Representative fluorescence guided radioluminescence images revealed preferential binding of [18F]HFB in regions consisting of dead cell nuclei (white arrows), whilst uptake of [18F]FDG was significantly greater near live MDA-MB-231 nuclei than near dead cell nuclei (orange arrows, top panel). (b) Quantitative ROI analysis showing uptake of [18F]FDG and binding of [18F]HFB in adherent and non-adherent MDA-MB-231 cells. Error bars are mean ± SEM, ***p ≤ 0.001, *p ≤ 0.05 and scale bar is 50 µm
