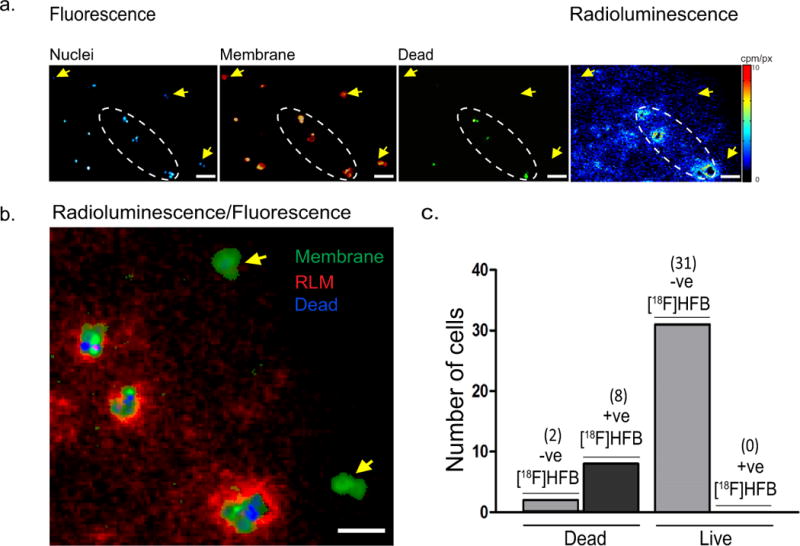
Fig. 4. Preferential accumulation of [18F]HFB in dead cell membranes.

(a) Representative fluorescence and radioluminescence images indicating accumulation of [18F]HFB in relation to localisation of MDA-MB-231 cell nuclei (blue) or dead cell nuclei (green) and membranes (red). No significant binding of [18F]HFB was visualised in live cell membranes (yellow arrows). (b) Co-registered fluorescence and radioluminescence images showed co-localisation of [18F]HFB (red) in regions (white dashed oval) consisting of both membrane fragments (green) and dead cell nuclei (blue). (c) Number of cell membranes, as defined by fluorescence membrane stain, associated with live and dead cell nuclei, according to their level of [18F]HFB labelling (+ve: positive, -ve: negative). Scale bar is 100 µm
