Fig. 2.
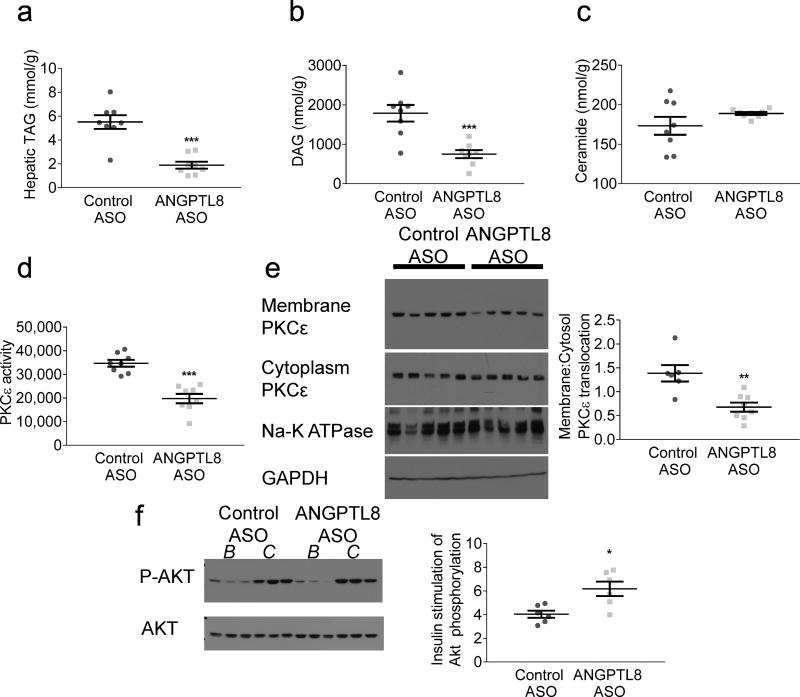
Hepatic lipid content and hepatic insulin signalling. (a) Hepatic triacylglycerol (TAG) content after a 6 h fast. (b) Hepatic DAG content after a 6 h fast. (c) Hepatic ceramide content after a 6 h fast. (d) Hepatic cell lysate PKCε activity and (e) PKCε translocation after a 6 h fast. Membrane:cytoplasm ratio quantified with respect to housekeeping proteins Na-K ATPase and glyceraldehyde-3-phosphate dehydrogenase (GAPDH). Graph in (e) represents membrane:cytoplasm PKCε abundance ratio. (f) Hepatic Akt phosphorylation, comparing basal (B) 6 h fasted livers with clamped (C) insulin-stimulated livers. Graph represents the ratio of Akt phosphorylation in the insulin-stimulated state to Akt phosphorylation in the basal state. For hepatic lipids and PKCε activity, data are the mean ± SEM of n = 8; for PKCε translocation, data are the mean ± SEM of n = 6 (control ASO) and mean ± SEM of n = 8 (Angptl8 ASO); for hepatic Akt phosphorylation, data are the mean ± SEM of n = 6. * p < 0.05; ** p < 0.01; *** p < 0.001 vs control

