Fig. 5.
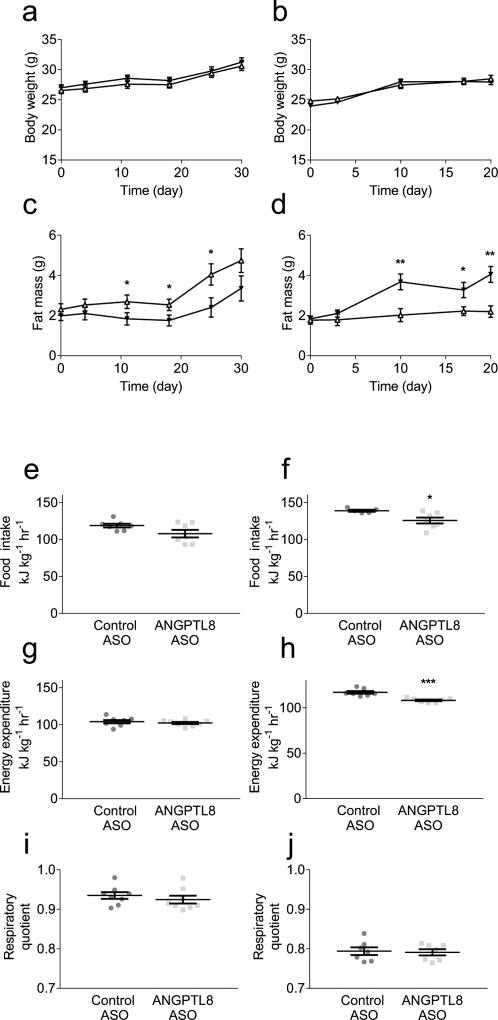
Murine growth curves and energy homeostasis. Whole-body adipose content assessed by 1H magnetic resonance spectroscopy; energy homeostasis assessed by metabolic cage analysis: Growth curve in (a) RC-fed mice and (b) HFD-fed mice. Fat mass accretion in (c) RC-fed mice and (d) HFD-fed mice (control ASO: white triangles; Angptl8 ASO: black triangles). Food intake assessed in (e) RC-fed mice and (f) HFD-fed mice. Energy expenditure assessed in (g) RC-fed mice and (h) HFD-fed mice. RQ assessed in (i) RC-fed mice and (j) HFD-fed mice. Metabolic cage variables were normalised to lean body mass. For RC-fed growth curves and fat mass assessments, energy expenditure and RQ data are the mean ± SEM of n = 8 in both groups. For HFD-fed growth curves and fat mass assessments, data are the mean ± SEM of n = 7 (control ASO) or mean ± SEM of n = 8 (Angptl8 ASO). For RC-fed food intake, HFD-fed energy expenditure and RQ data are the mean ± SEM of n = 7 in both groups. For HFD-fed food intake, data are the mean ± SEM of n = 5 (control ASO) or mean ± SEM of n = 7 (Angptl8 ASO). * p < 0.05; ** p < 0.01; *** p < 0.001 vs control

