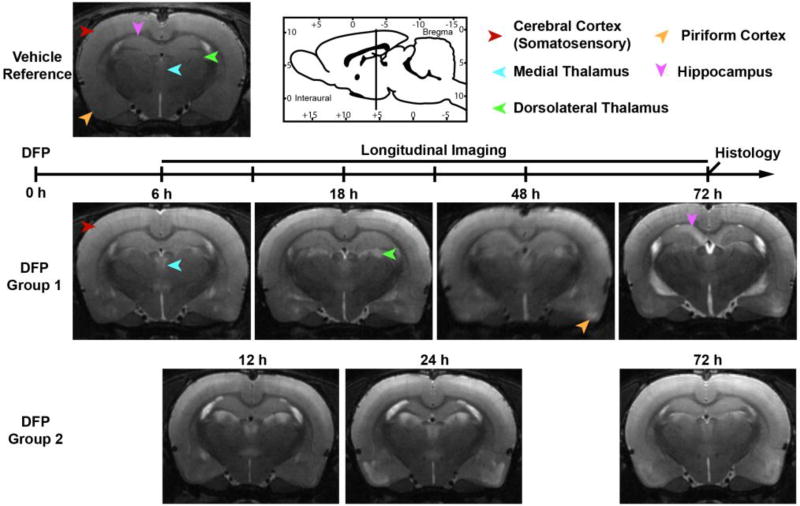
Figure 1. T2w anatomic MR images depicting the spatiotemporal progression of brain lesions following acute DFP intoxication.
Lesions were characterized by localized hyperintensity compared to neighboring tissue, and a vehicle control reference scan. Group 1 and Group 2 images each represent a single animal imaged at 6, 18, 48 and 72 h, or 12, 24 and 72 h respectively. Note that Group 1 begins MR imaging 6 h prior to Group 2. Across time points, images were selected to match bregma to ≤ 250 µm. Arrows indicate the positions of brain regions displaying hyperintense lesions at one or more time points following intoxication. Sagittal-view atlas reference was adapted from Watson and Paxinos, The Rat Atlas in Stereotactic Coordinates (Paxinos, 2007).

