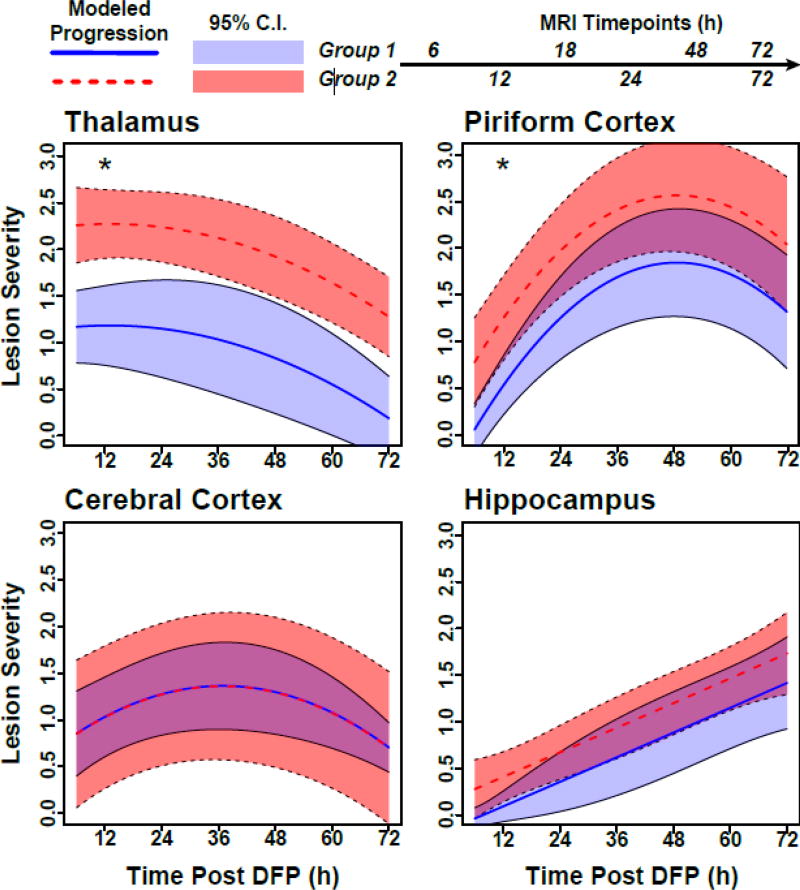
Figure 4. Mixed-model regression from multiple brain regions demonstrate that the lesion severity changes over time in a brain-region and imaging group-dependent manner.
Each progression curve is modeled on data from six animals from Group 1 (solid lines) or six animals from Group 2 (dashed lines). 95% confidence bands are included around the curves for each imaging group. Group 1 animals had significantly lower lesion severity scores for the thalamus and piriform cortex than Group 2 animals over the entire study period (denoted with an “*”). Note: Group 1 animals received anesthesia 6 h earlier than Group 2 animals.

