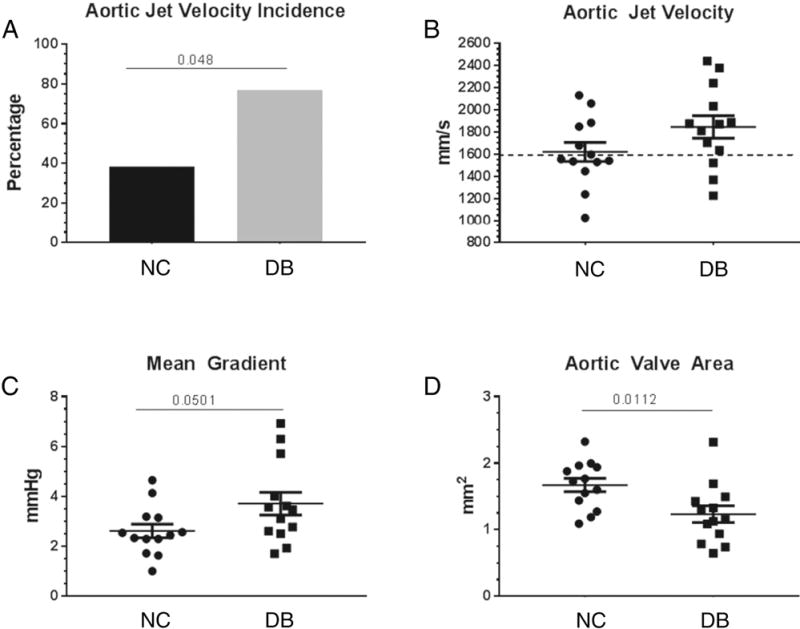
Figure 2.

Hemodynamic echocardiography analysis. Aortic jet velocity was measured in 14 month old DB and NC fed LDLr−/−ApoB100/100 mice. The mean gradient was calculated by the VisualSonic software and the aortic valve area (AVA) was calculated with the continuity equation. (A) incidence of aortic jet velocity above 1600 mm/s; (B) scatter plot of single aortic jet velocity values, 1600 mm/s cut –off shown by dotted line; (C) scatter plot of single mean gradient values; (D) scatter plot of single AVA values. Data are normally distributed. Data analyzed with Unpaired t-test, p values are shown within the graphs. Mean ± S.E.M., n=13.
