
Figure 3.
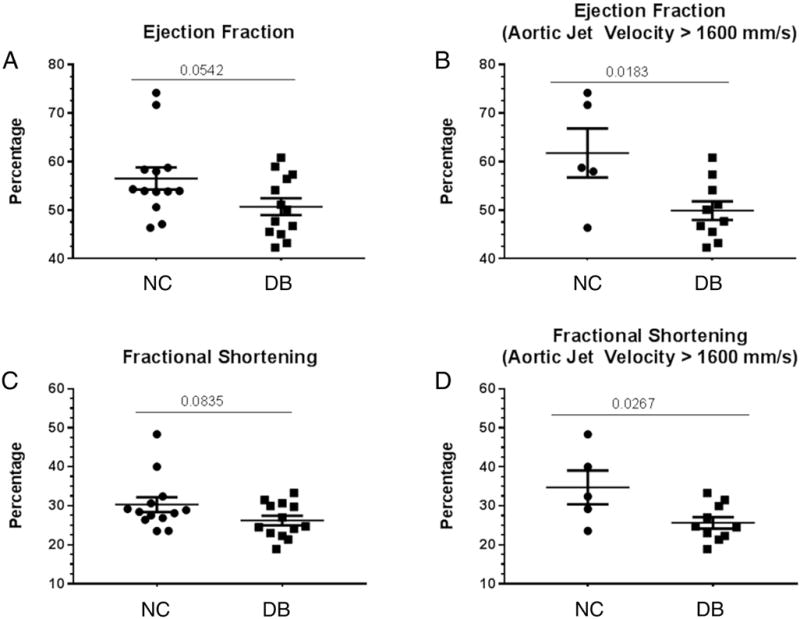
Hemodynamic echocardiography analysis. The ejection fraction and fractional shortening were calculated by the VisualSonic software following echocardiography of 14 month old LDLr−/−ApoB100/100 fed DB and NC diets. (A) Scatter plot of mean Ejection fraction of all 13 mice in the study; (B) scatter plot of mean ejection fraction of only mice with aortic jet velocity > 1600 mm/s; (C) scatter plot of mean fractional shortening of all 13 mice in the study; (D) scatter plot of mean fractional shortening of only mice with aortic jet velocity > 1600 mm/s. Data are normally distributed. Data analyzed with Unpaired t-test, p values are shown within the graphs. Mean ± S.E.M. For A and C, n=13 for both NC and DB. For B and D, n=5 for NC and n=10 for DB.