
Figure 5.
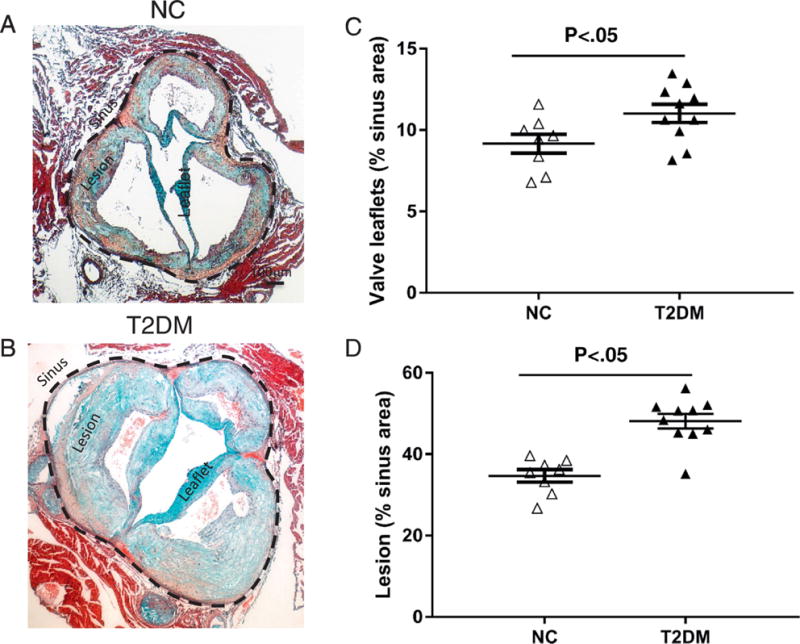
Quantification of aortic valve leaflet thickness and lesion size. Movat Pentachrome staining of representative sinus sections from 14 month old LDLr−/−ApoB100/100 fed NC (A) or DB (B) diet. Morphometric analysis of leaflet thickness (C) and atherosclerotic lesion size (D) of 14 month old LDLr−/−ApoB100/100 mice fed the DB or NC diet; Data are normally distributed. Data analyzed with Unpaired t-test, p values are shown within the graphs. Mean ± S.E.M., n=7 - 10.