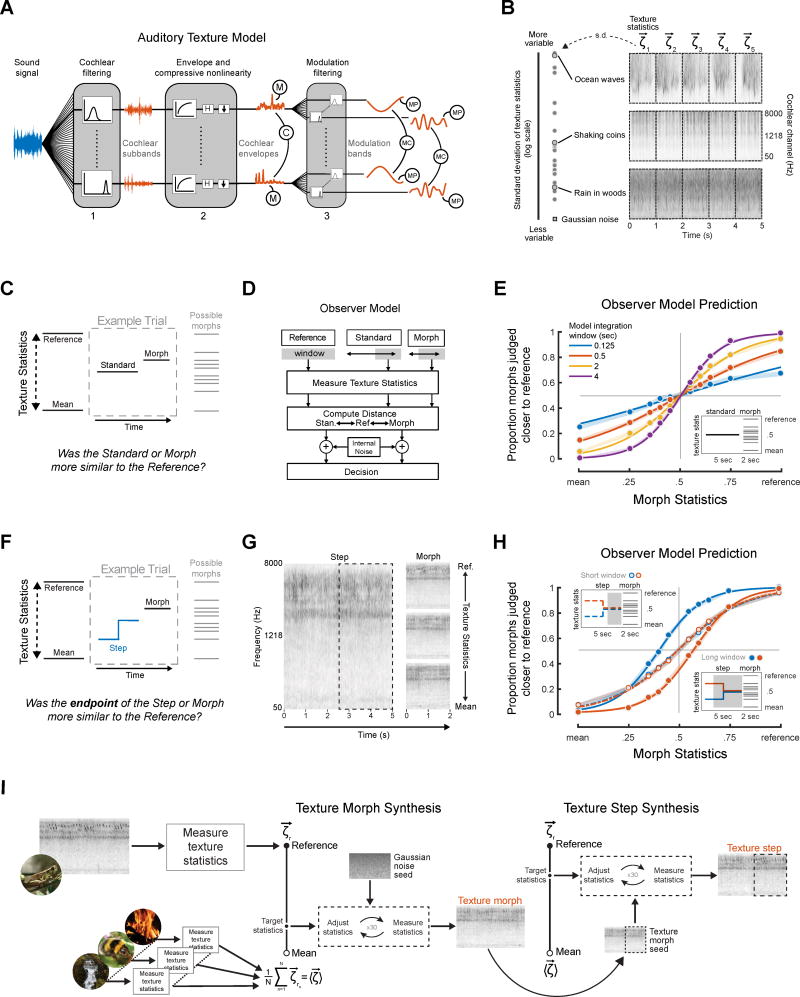
Figure 1. Sound texture: statistics, modeling, and stimulus generation.
(A) Auditory texture model [5]. Statistics are measured from an auditory model capturing the tuning properties of the peripheral and subcortical auditory system in three stages. The statistics measured from this model include marginal moments and pair-wise correlations at different stages of the model. (B) Variability of statistics in real-world textures. Left panel shows the standard deviation of texture statistics measured from multiple 1s excerpts of each of a set of 27 textures used in the subsequent experiments. Right panel shows spectrograms of 5 s excerpts of example textures (ocean waves, shaking coins, and rain in the woods). Dashed lines denote borders of 1s segments from which statistics were measured. Some real-world textures have statistics that are quite stable at a time scale of 1s (also evident in the consistency of the visual appearance of 1s spectrogram segments), while others exhibit variability (and would only produce stable estimates at longer timescales). (C) Schematic of texture discrimination experiment trial structure. Listeners judged whether the standard or the morph was most similar to a reference texture. (D) Observer model. The model averaged statistics within a rectangular window extending from the endpoint of the trial stimuli and compared them to the statistics of the reference texture. The model and stimulus generation assumed a Euclidean metric within each class of statistics (see Methods). (E) Texture discrimination by the observer model using four different window sizes. Plot shows the proportion of morphs judged closer to reference as a function of the morph statistics (drawn from the line between the mean and reference statistics). Model results suggest task could be performed with a wide range of analysis windows. The slopes of the psychometric functions were determined in part by noise added at the decision stage of the model (see Methods). Here and elsewhere, shaded regions show SEM obtained via bootstrap (10,000 samples). (F) Schematic of step discrimination trial structure. Listeners judged whether the step or the morph was most similar to a reference texture. Listeners were told that the step stimulus would undergo a change, and to base their judgments on the end of the stimulus. (G) Spectrograms of example step experiment stimuli for the “swamp insects” reference texture. The step occurs 2.5s from the endpoint. The morph examples have statistics from the reference, midpoint and mean. (H) Performance of the observer model on a texture step experiment using two different window sizes. When the integration window extends beyond the step (solid lines, bottom right inlay) the observer model exhibits a difference in the point of subjective equality between conditions, but not otherwise (dashed lines, top-left inlay). (I) Synthesis of texture morphs and steps. A reference texture was passed to the auditory model, which measured its texture statistics and generated target texture statistics at intermediate points along a line in the space of statistics between the reference texture statistics and the mean statistics of a large set of textures. Synthesis began with Gaussian noise and adjusted the statistics to the target values. Texture steps were created by further adjusting a portion (dashed region) of a texture morph to match the statistics of another point on the line between the reference and mean texture.
See also Figure S1 and S2 and Table S1.

