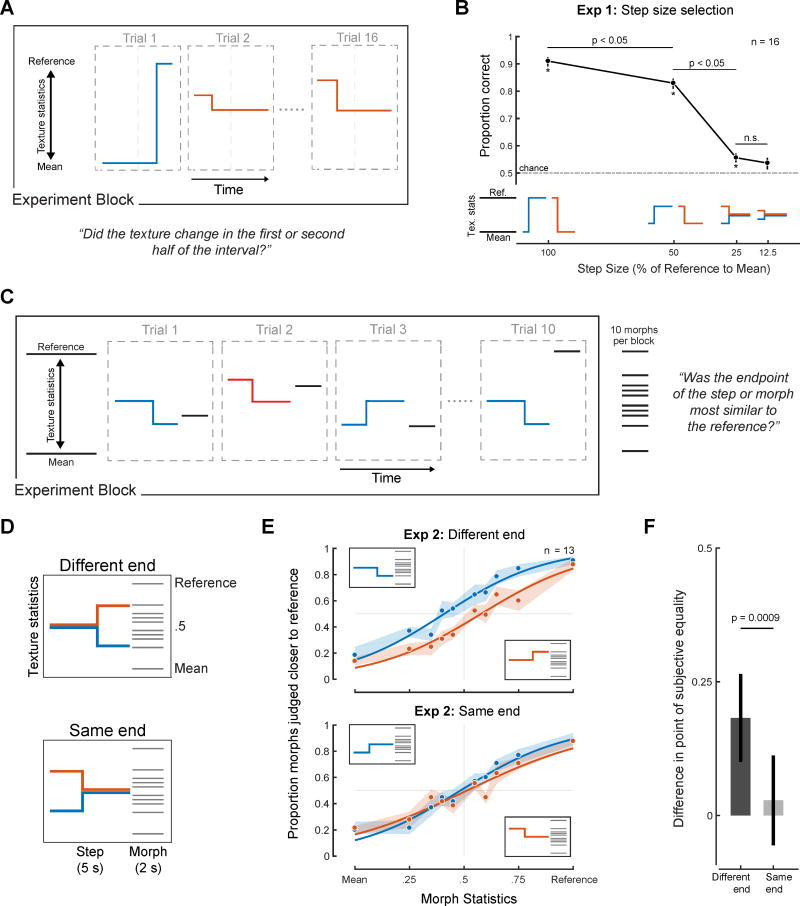
Figure 2. Design and results of Experiments 1 and 2 (Step size selection and task validation).
(A) Schematic of Experiment 1 block and trial structure. Listeners heard a texture step and judged whether a change occurred in the first or second half of the stimulus. The step was positioned at either 25% or 75% of the stimulus duration. (B) Localization performance of human listeners vs. step size. Error bars show SEM, obtained via bootstrap. Asterisks indicate significant differences from chance (t-test, two-tailed, p < 0.05). p values between data points indicate result of paired t-tests between conditions. (C) Schematic of Experiment 2 (testing task compliance). Listeners judged whether the step or the morph was most similar to a reference texture. Listeners were informed that the first stimulus (the step) could undergo a change and to base their judgments on the end of that stimulus. (D) Schematics of experimental conditions. (E) Results of Experiment 2. Shaded regions show SEM of individual data points, obtained by bootstrap. Solid lines plot logistic function fits. (F) Difference between fitted points of subjective equality for the upward and downward step conditions (computed separately for the same start and same end conditions). Here and elsewhere, error bars show bootstrapped 95% confidence intervals on the difference, obtained by bootstrap.
See also Figure S3 and S7.

