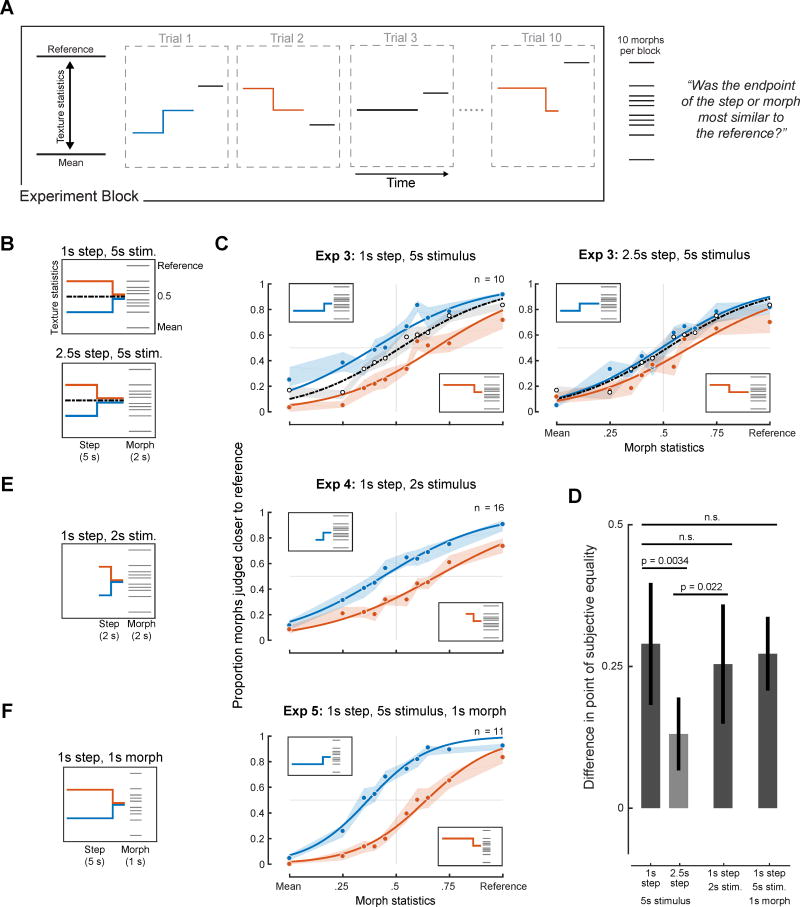
Figure 3. Design and results of Experiments 3–5 (Effect of texture step on texture discrimination).
(A) Schematic of block and trial structure used in Experiment 3. (B) Schematic of stimulus conditions of Experiment 3. (C) Results of Experiment 3. Here and elsewhere, shaded regions show SEM of individual data points obtained by bootstrap and curves plot logistic function fits. (D) Difference between points of subjective equality for the upward and downward step conditions (computed separately for the different conditions of Experiments 3–5). Error bars show 95% confidence intervals on the difference, obtained by bootstrap. (E) Results of Experiment 4 (with 2s step stimuli). (F) Results of Experiment 5 (with 1s morph stimuli).
See also Figure S3.

