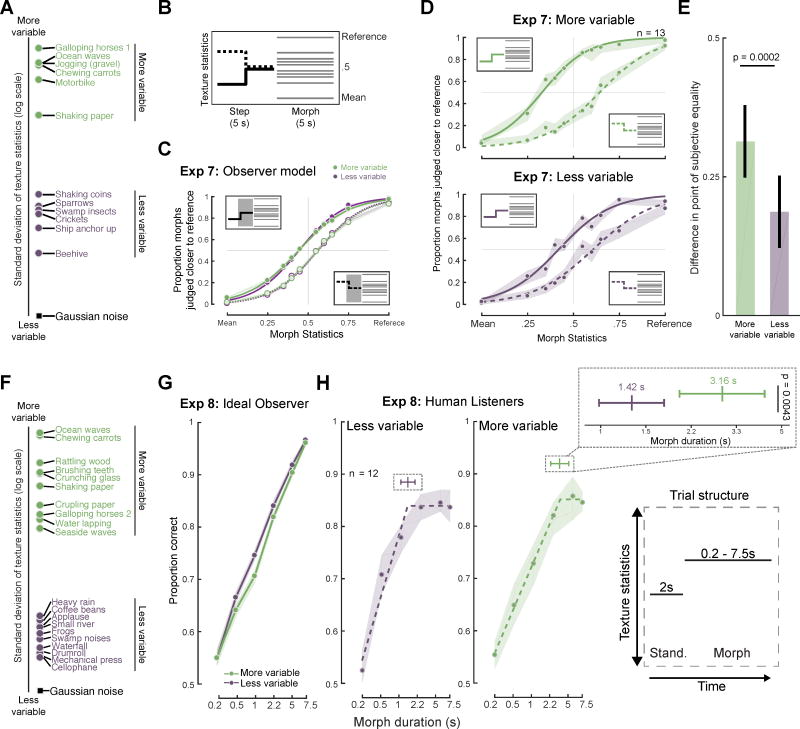
Figure 5. Results of Experiment 7 & 8 (Effect of texture variability).
(A) Variability in texture statistics measured across 1-s windows for the 12 reference textures from Experiment 7. Variability of Gaussian noise statistics is provided for comparison. (B) Schematic of stimuli for Experiment 7 (step discrimination). (C) Results from observer model plotted separately for more and less variable textures. The model used a 3s averaging window for both sets, and showed similar biases, illustrating that the results need not differ between the stimulus sets. Here and elsewhere, shaded regions show SEM obtained via bootstrap and curves plot logistic function fits. See Figure S4 for observer model results for additional analysis window durations. (D) Results from human listeners, plotted separately for more variable (upper panel) and less variable (lower panel) textures. (E) Difference between points of subjective equality between upward and downward step conditions. (F) Variability in texture statistics for the 10 reference textures from Experiment 8 (discrimination of textures varying in duration). (G) Results from observer model integrating over the entire duration of the morph interval. The shaded region shows SEM obtained via bootstrap. (H) Performance of human listeners vs. duration, plotted separately for less and more variable textures. Dashed lines show piecewise linear “elbow” function fits. Top inset shows inflection points of piecewise linear functions fit to data for the two texture groups (with 95% confidence intervals). Bottom inset shows trial structure.
See also Figure S3, S4 and S5 and Table S3.

