. 2018 Apr 30;42(2):229–238. doi: 10.5535/arm.2018.42.2.229

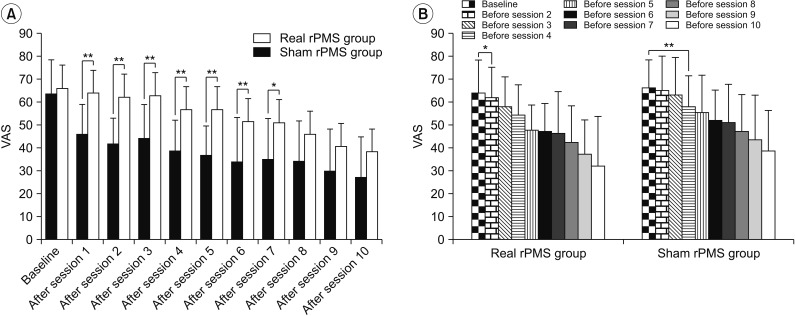
Fig. 4. Comparison of VAS between the real rPMS group and the sham rPMS group after each session. (A) From sessions 1 to 7, the VAS of the real rPMS group evaluated after each session was significantly lower than that of the sham rPMS group. Changes in VAS evaluated before each session of the real rPMS group and sham rPMS group. (B) Compared to baseline VAS, the real rPMS group showed significant VAS reduction starting from session 2 (p=0.025) whereas the sham rPMS group showed significant VAS reduction starting from session 4 (p=0.003). VAS, visual analogue scale; rPMS, repetitive peripheral magnetic stimulation. *p<0.05, **p<0.01.

Fig. 4