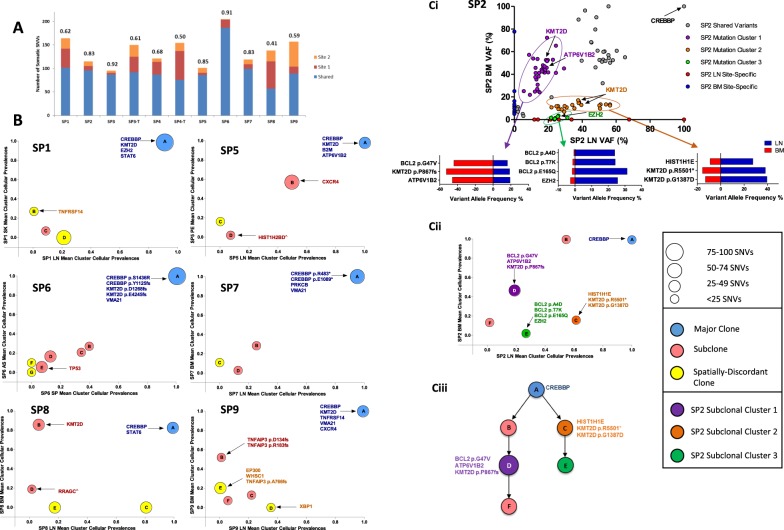
Fig. 1.
Patterns of intra-tumor heterogeneity in spatially separated tumors. a Proportion of shared and site-specific somatic SNVs in each case. The Jaccard Similarity Coefficient (JSC) is given above each bar. Site 1 is LN and site 2 BM with the following exceptions: SP1 site 2: skin (SK), SP4 site 1: LN1, site 2: LN2, SP4-T site 2: skin, SP5 site 2: pleural effusion (PE), SP6 site 1: ascites (AS), site 2: spleen (SP) (T: transformed). b Pairwise mean cluster cellular prevalence plots. Derived mutation clusters represent the mean cellular prevalence of all mutations within a cluster. Each cluster is denoted by a circle with the size of the circle equivalent to the number of mutations within the cluster. The letter in each circle relates to the specific cluster within the clonal phylogenies in Figure S3. Mutations in known FL-associated genes are highlighted to show their locations within clusters. ^Site-specific variant, although the mean cluster cellular prevalence is reported as marginally subclonal. c (i) Variant allele frequency (VAF) plot of all somatic mutations in case SP2. VAFs for selected mutations from three highlighted subclones in purple, orange, and green are shown in the horizontal bar graphs. c (ii) Mean cluster cellular prevalence plot and c (iii) clonal phylogeny of SP2 confirming the distinct subclones (purple, orange, green) seen in the VAF plot

