
Figure 4.
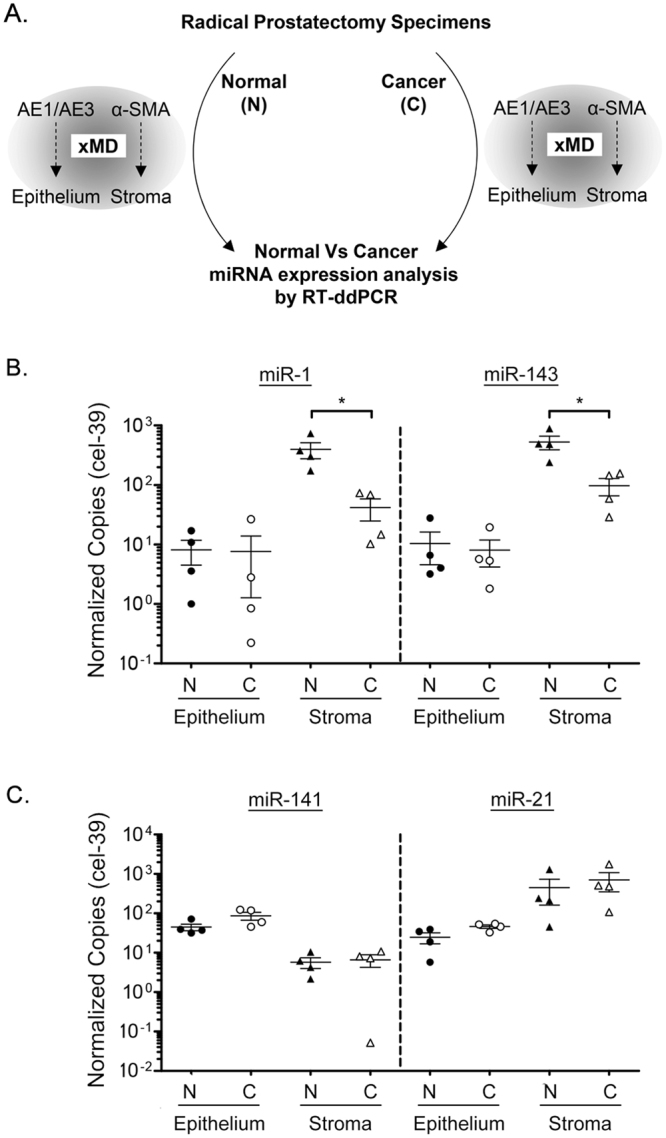
Reduced miR-1 and miR-143 levels in PCa-associated tumor stroma. (A) Schematic of normal (N) versus cancer (C) comparison between miRNA levels in xMD microdissected stroma versus epithelium. Stroma was isolated by α-SMA xMD, and epithelium isolated by AE1/AE3 xMD, using JHU samples from Fig. 1B (n = 4). Levels of each miRNA quantified by RT-ddPCR and copy number normalized per 10,000 cel-39. (B) miR-1 and miR-143 levels in normal versus malignant epithelium and stroma. (C) miR-141 and miR-21 levels in normal versus malignant epithelium and stroma. Normal sample values presented from Fig. 2C for comparison. Bars represent mean and standard error. Log Scale. P-values determined by Wilcox Rank Sum analysis. *p < 0.05.