Figure 1.
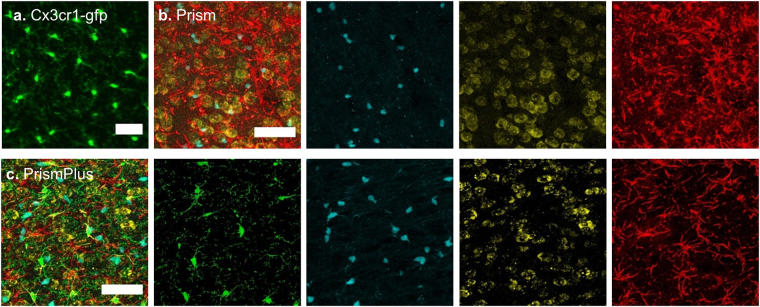
Confocal images of fluorophores expressed in four cell types in the cortex (approximately layer III-IV) of different mouse lines. (a) Green fluorescent protein (GFP) is expressed in microglia of Cx3cr1-gfp mouse. (b) Merged image of Cyan fluorescent protein (CFP) expressed in oligodendrocytes, yellow fluorescent protein (YFP) expressed in neurons and Discosoma sp. red fluorescent protein (DsRed) expressed in astrocytes of Prism mouse. (c) Merged image of CFP expressed in oligodendrocytes, GFP expressed in microglia, YFP expressed in neurons and DsRed expressed in astrocytes of quadruple-colored ‘PrismPlus’ mouse line. Single channel images from Prism and PrismPlus mouse lines are shown right to the merged images, b & c, respectively. Z-stack images of 20 microns thick sections were acquired either sequentially (a) or in lambda mode (b,c) using Zeiss LSM 710, 20x/0.8 NA objective and are presented as maximum projected intensity. Scale bar = 50 µm.

