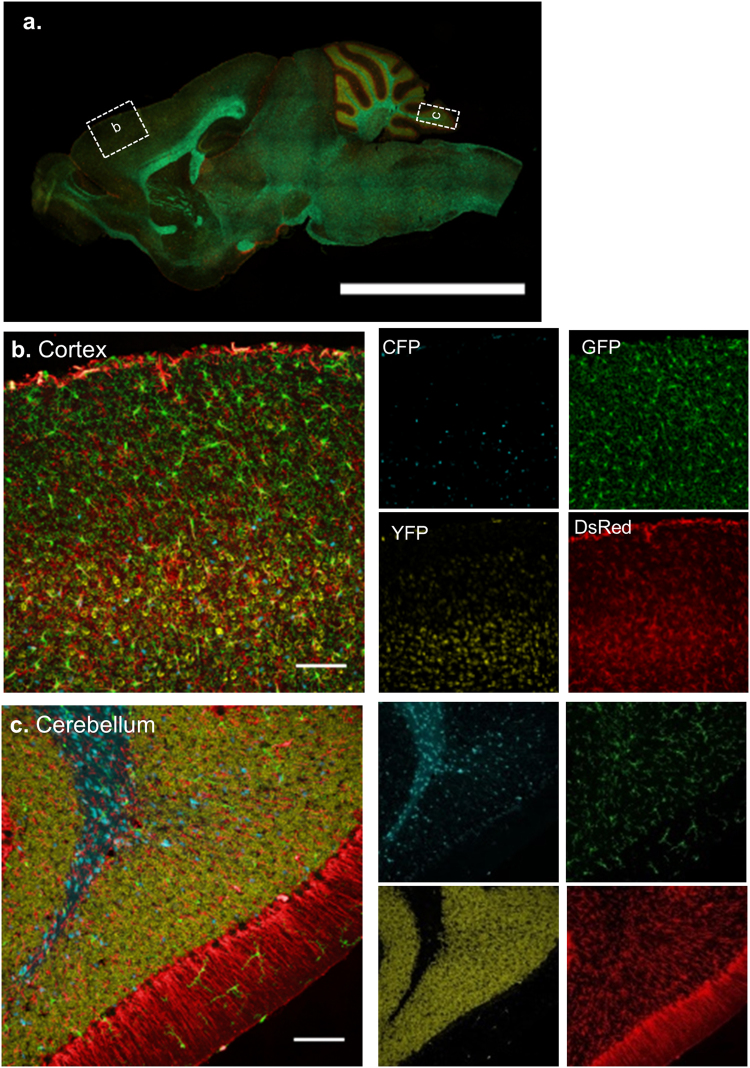
Figure 2.
Expression of distinct fluorophores in CNS cells in different brain regions in a PrismPlus mouse line. (a) Epifluorescence image of a sagittal mouse brain section depicting approximate brain regions (dashed boxes) for images in b and c. CFP-expressing oligodendrocytes, GFP-expressing microglia, YFP-expressing neurons and DsRed-expressing astrocytes, and merged confocal images in cortex (b) and cerebellum (c) of a PrismPlus mouse. Single channel images of (b) and (c) are shown right to the merged images. Images are maximum projected intensity of 20 um thick section. Scale bar in a = 5 mm; b & c = 100 µm.

