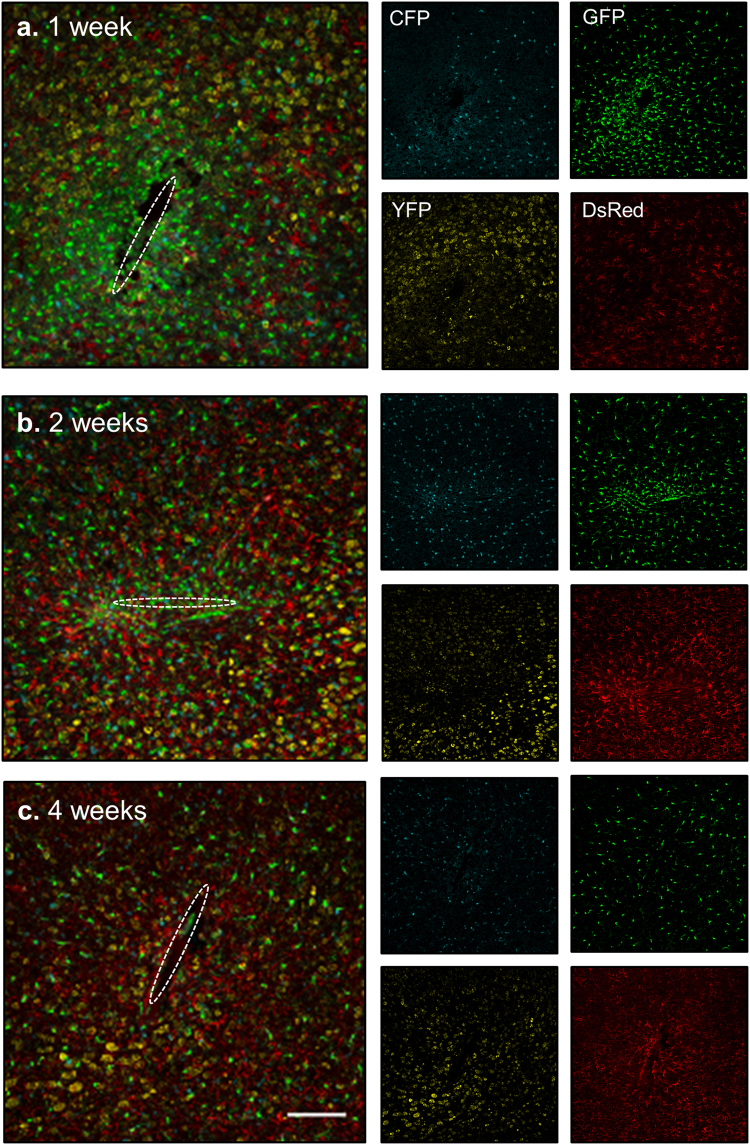
Figure 4.
Cellular response to brain-implanted devices at multiple time points using PrismPlus mouse line. (a–c) Confocal images (merged) of cellular response to brain implanted devices at 1 week (a), 2 weeks (b) and 4 weeks (c) post implant. Dashed white ellipse represents the implant location. Merged images are separated into individual channels. Images are maximum projected intensity of 20 um thick sections and are approximately from the same depth (approximately 500 µm deep) in the cortex. Images in Fig. 4(a–c) were captured and processed using same settings. Objective: Plan-Apochromat 20x/0.8; Laser power: 405 nm: 5%, 488 nm: 6% and 543 nm: 0.2%. Scale bar = 100 µm.

