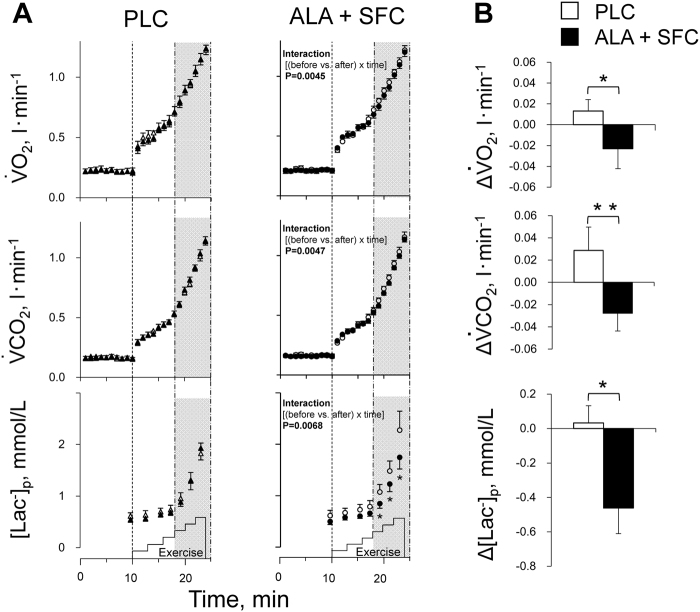
Figure 2.
(A) Oxygen consumption rate (), carbon dioxide production rate (), and plasma lactate concentration ([Lac−]p) responses over intensities during the graded cycling exercise test in the PLC trial (left) and in the ALA + SFC trial (right). The average value per minute in and , and the values at every intensity of [Lac−]p, from rest to the highest workload of 75 W, at which all subjects could maintain the rhythm of pedalling at 60 cycles/min. Open symbols, before a supplement intake period; solid symbols, after a supplement intake period. Values are the means ± SE for 9 subjects. *P < 0.05 vs. before the supplement intake period. (B) The average changes in , , and [Lac−]p over intensities ≥45 W during graded cycling exercise after a supplement intake period. Values are the means ± SE for 9 subjects. *P < 0.05 and **P < 0.01 between the PLC and ALA + SFC trials.

