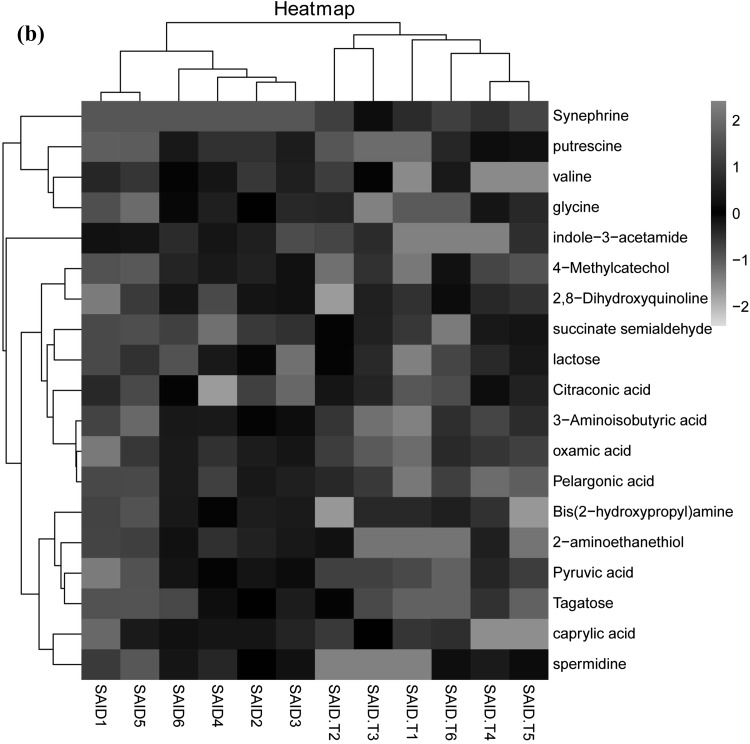
Fig. 3.
Hierarchical clustering analysis (HCA) and heat maps for different metabolites from the three treatments. a HCA of metabolites from cows (n = 6) fed control diet (CON) versus cows fed SARA induced diet (SAID); b HCA of metabolites from cows (n = 6) fed SAID versus cows (n = 6) fed SARA induced diet with thiamine supplementation (SAID + T). Rows represent metabolites and columns represent samples. Cells were colored based on the signal intensity measured in rumen, light red represented high rumen levels while green showed low signal intensity and black cells showing the intermediate level


