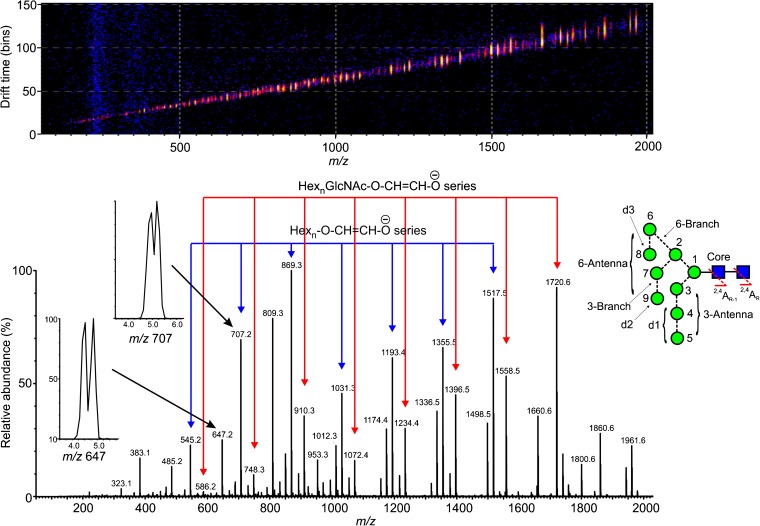
Figure 1.
(top) Driftplot display of the fragment ions from Man9GlcNAc2 (9) produced in the trap region of the Synapt G2Si mass spectrometer. The spectrum of this compound is shown below with the two main series of ions discussed in this paper (Hexn-O-CH=CH-O- (red) and HexnGlcNAc-O-CH=CH-O-, blue) indicated. The two inserts show separation of two isomeric structures for m/z 647 and m/z 707. To the left is the structure of Man9GlcNAc2 showing the numbering system and the various regions of the molecule discussed in the text

