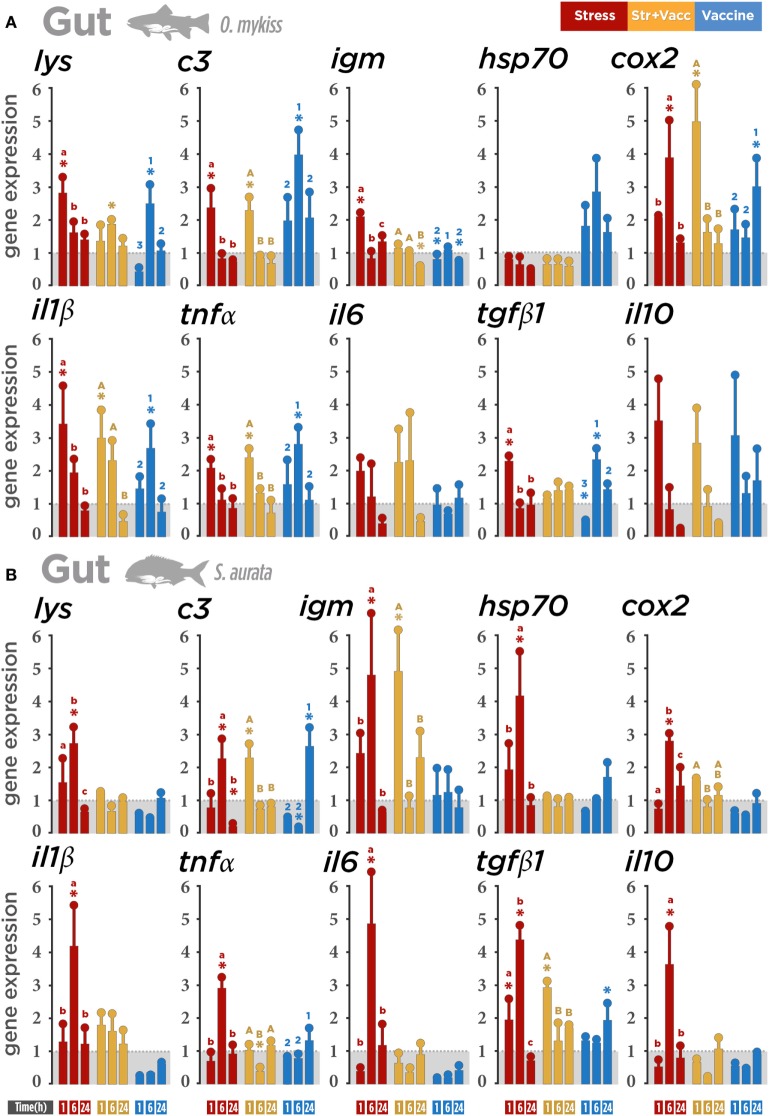
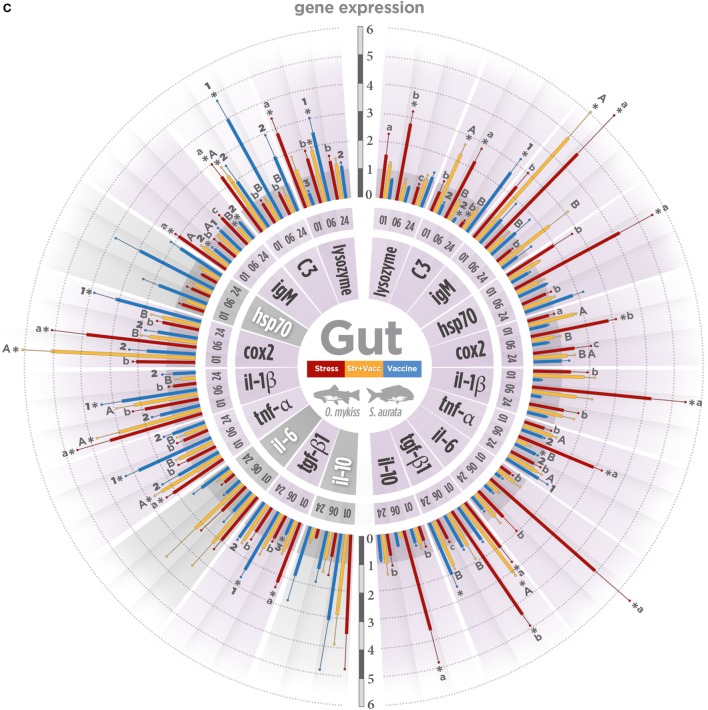
Figure 4.
Gene expression level in gut-associated lymphoid tissue (GALT) after a biotic (Vibrio anguillarum bacterin), abiotic (air exposure), or the combination of both stressors (vaccine + air exposure) at 1, 6, and 24 h post-stress. Quantitative real-time PCR quantification of specific mRNA immune and stress transcripts (lysozyme, c3, igm, hsp70, cox2, Il1β, tnfα, il6, tgfβ1, and il10) in (A) rainbow trout and (B) gilthead seabream. (C) Integrative comparison of GALT transcriptomic responses. β-Actin and 18s were chosen as housekeeping genes in rainbow trout and gilthead seabream, respectively. Different colors indicate different treatments: red (air exposure), orange (vaccine + air exposure), blue (vaccine), and gray (ctrl; control). Time zero represents the end of the acute air exposure stress (for the air exposure and the vaccine + air exposure) or 24 h after bath vaccination (for vaccine group). Data are represented as mean ± SE (n = 8 per sampling time point). Significant differences are indicated by lower case in the air exposure group, by upper case in the vaccine + air exposure group, and by numbers in the vaccine group. Asterisk (*) indicates significant difference of each treatment versus control (p < 0.05).


