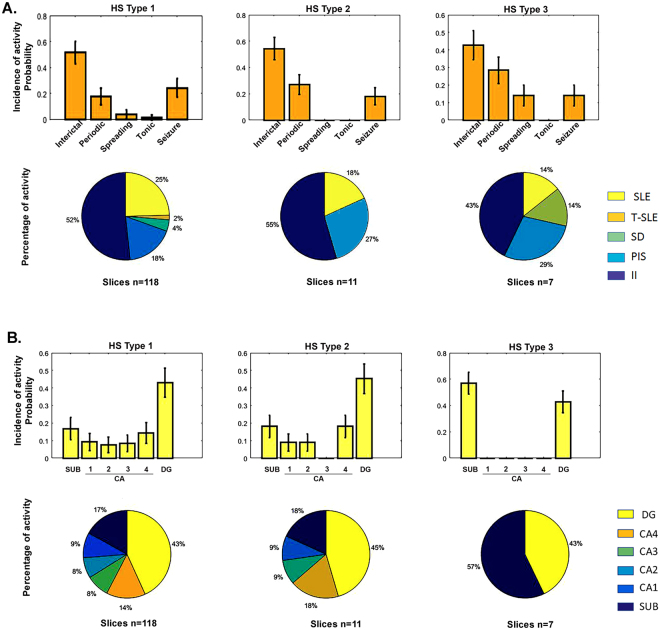
Figure 4.
Distribution of epileptiform activity by ILAE HS type. (A) Conditional probability distribution of the different HS types to generate specific patterns of epileptiform activity P (HS type|epileptiform activity). (B) Conditional probability distribution of the different HS types to present epileptiform activity susceptibility in the different hippocampal subfields P (HS Type|hippocampal area). Bars graphs represent the mean probability with the corresponding standard deviation. Circular graphs represent the absolute frequencies. SLE: Seizure-like events; T-SLE: Tonic seizure-like events; SD: Spreading depression-like events; PIS: Periodic ictal spiking; II: interictal-like events.

