Figure 1.
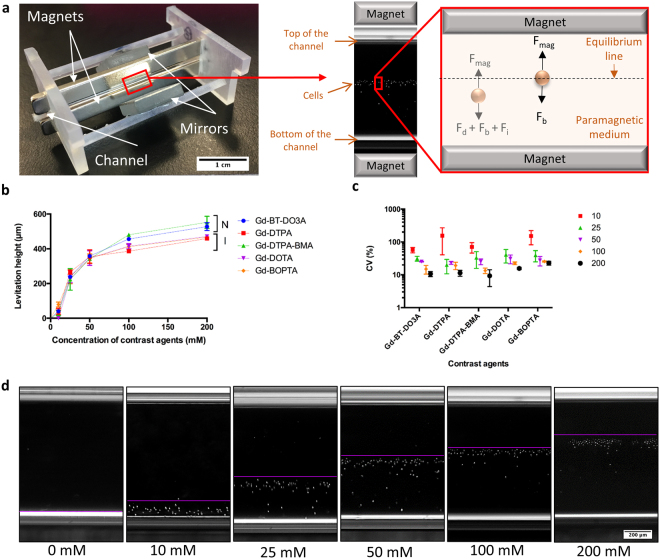
Short-term levitation of D1 ORL UVA cells in the magnetic levitation platform. (a) Photograph of magnetic levitation platform and forces which act on cells in it until equilibrium; fluidic drag force (Fd), inertial force (Fi), buoyancy force (Fb) and magnetic force, Fmag, and at the equilibrium position; Fmag and Fb. Microcapillary channel, in which cells are levitated and cultured, is placed between two permanent neodymium magnets whose same negative poles are facing each other. Mirrors are placed at each open side of the channel at 45° and used to visualize cells in the channel with conventional microscopy systems. (b,c) The relationship between Gd concentrations and, levitation heights of cells (from bottom surface of capillary) (b) and CV (%) of levitation heights (c) after 10 min of levitation in different Gd-based solutions (Gd-BT-DO3A, Gd-DTPA, Gd-DTPA-BMA, Gd-DOTA and Gd-BOPTA). Data are plotted as mean of replicates with error bars (±SD). N: nonionic agents, I: ionic agents. (d) Micrographs of levitated cells after 10 min of levitation in the medium containing Gd-BT-DO3A at variable concentrations (0, 10, 25, 50, 100 and 200 mM). The lines show the upper level of the levitated cell population. Scale bar: 200 μm.

