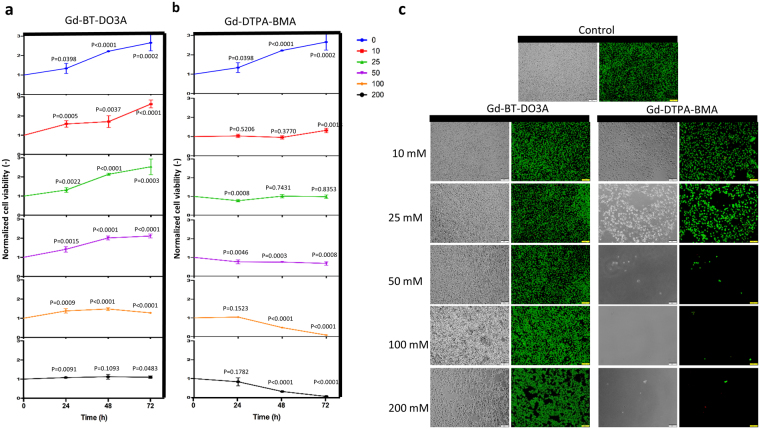
Figure 2.
Long-term culture viability results of D1 ORL UVA cells. (a,b) Cell viability for long-term culturing with Gd-BT-DO3A and Gd-DTPA-BMA at increasing concentrations (0, 10, 25, 50, 100 and 200 mM), respectively. Cell viability was determined with MTT assay. Data are plotted as mean of replicates with error bars (±SD). Groups were evaluated using the unpaired Student’s t-test. Statistical significance was defined as P < 0.05. (c) Fluorescent and phase-contrast microscopy images of D1 ORL UVA cells cultured for 72 h with 0, 10, 25, 50, 100 and 200 mM Gd-BT-DO3A and Gd-DTPA-BMA (live: green, dead: red). Cell viability was visualized by live-dead staining (Calcein/PI). Cells were cultured in the standard culture medium, as a control. Scale bars: 100 μm.

