Figure 3.
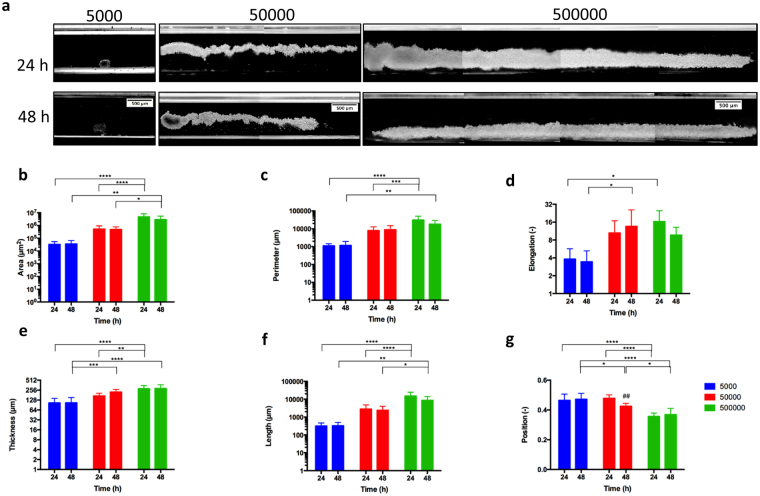
3D cellular organization of D1 ORL UVA cells under microgravity. (a) Micrographs of cells levitated and assembled for 24 and 48 h (with 100 mM Gd-BT-DO3A) at different cell numbers (total 5000, 50000 and 500000 cells). Scale bars: 500 μm. (b–f) Quantitative description of the cellular clusters formed for 24 or 48 h with magnetic levitation (100 mM Gd-BT-DO3A) at different cell numbers (total 5000, 50000 and 500000 cells); (b) area, (c) perimeter, (d) elongation, (e) thickness and (f) length, and (g) position of the clusters between magnets (the top point of the bottom magnet:0, the bottom point of the top magnet: 1). Data are plotted as mean of replicates with error bars (±SD) and statistically analyzed using a two-way ANOVA and Sidak posthoc test. Statistical significance was defined as P < 0.05.

