Figure 1.
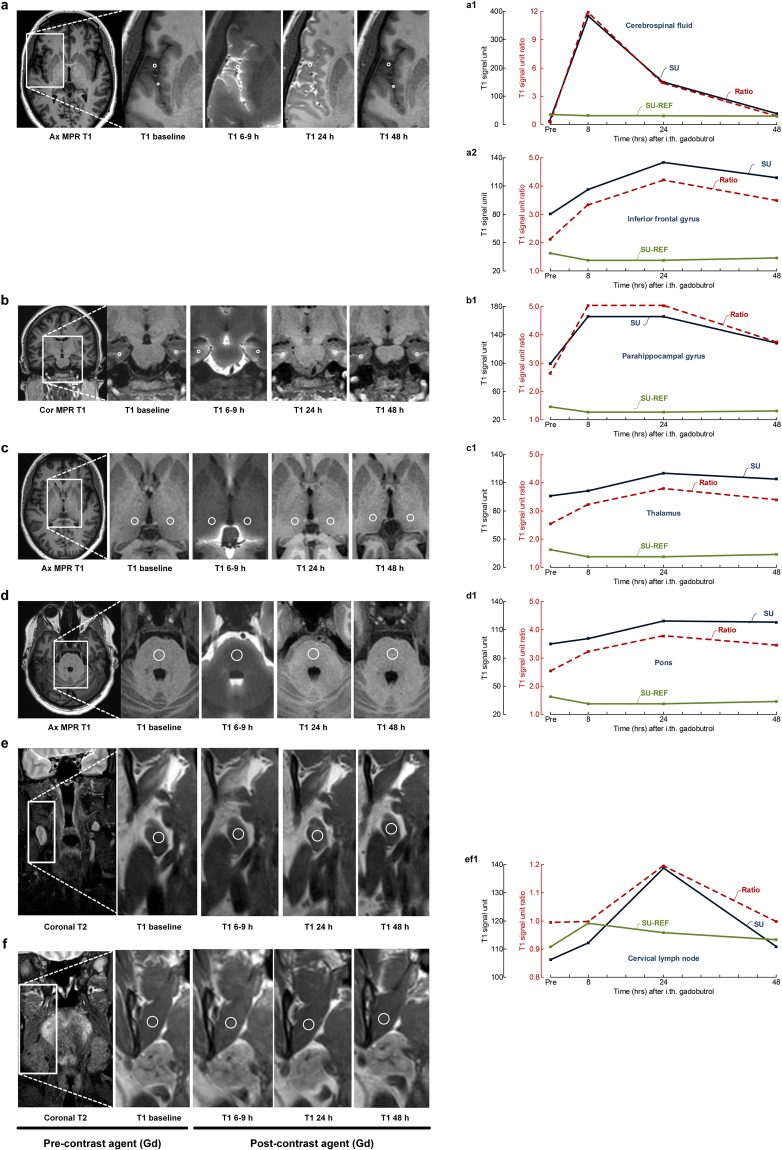
The enrichment of CSF tracer is illustrated in one of the study patients (no 5) at multiple time points within different anatomical regions, including (a) CSF nearby inferior frontal gyrus and parenchyma of inferior frontal gyrus, (b) parenchyma of parahippocampal gyrus, (c) thalamus, (d) pons, (e) a cervical lymph node. The medial pterygoid muscle (f) served as reference tissue in the neck region. The reference tissue from the head region (superior sagittal sinus) is not shown. The left column shows axial (ax) and coronal (Cor) multiplanar reformatting (MPR) T1 images from the head region (a–d) and coronal neck T2 images (e,f) to give an overview of the regions from which the magnified images in column 2–5 are retrieved. Column 2 from left presents MRI at baseline (before intrathecal tracer administration; pre) and three subsequent imaging time points (MRI columns 3–5). All images are T1 weighted, except from the image to the left in figure part 1e-f, which is T2 weighted with fat suppression used for location of lymph nodes. The CSF tracer uptake was measured in the T1 weighted images, and in all locations a-f. All measured signal units were normalized against a reference tissue to correct for any baseline shift of image greyscale between time points. The regions of interest are marked by an open circle. Reference tissue was blood of superior sagittal sinus for intracranial MRI (not shown) and medial pterygoid muscle for neck MRI. To the right is presented trend plots of signal units (blue lines for location and green for reference tissue) and signal unit ratios (red stippled lines) for the different anatomical locations in patient no 5, including (a1) CSF nearby inferior frontal gyrus, (a2) parenchyma of inferior frontal gyrus, (b1) parenchyma of parahippocampal gyrus, (c1) parenchyma of thalamus, (d1) parenchyma of pons, and (ef1) parenchyma of cervical lymph node and the medial pterygoid muscle. In this patient, the CSF enrichment nearby inferior frontal gyrus reached maximum after 8 hours (a1), while it reached maximum after 24 hours within inferior frontal gyrus (a2), thalamus (c1), pons (d1) and cervical lymph node (ef1). The CSF tracer enrichment was at the same level after 8 and 24 hours within the parahippocampal gyrus.

