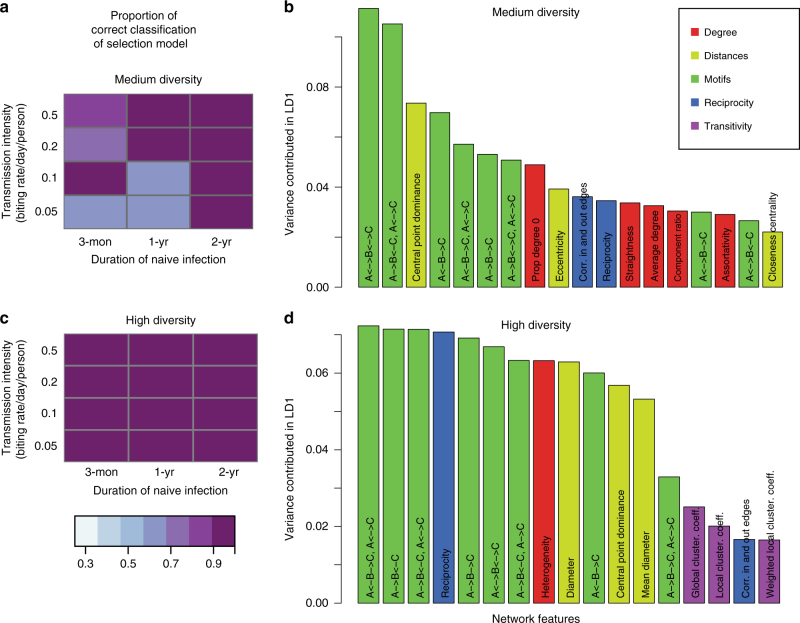
Fig. 3.
Importance of network features for the classification and the power of correct classification of the selection model. Results are for different levels of duration of naïve infection, biting rate, and var gene pool size (medium diversity [1,200–2,400] in a, b and high diversity [12,000–24,000] in c, d). a, c The shade of colored squares indicates the proportion of correct assignments of the immune selection scenario. Variance contribution of network features in the first linear discriminant function (LD1) are displayed with color-codes corresponding to the feature groups (b, d; see Supplementary Table 1 for feature groups). Only top features that explain at least 90% of the variance are shown. In simulations with a gene pool of medium diversity a, the proportion of correct assignments of the selection model increases with increasing infection duration and biting rate. When the genetic pool is of high diversity, the selection model is almost always perfectly assigned c, while neutral and generalized immunity models are harder to differentiate, even under high transmission and long infection durations (see Supplementary Table 2). The proportions of different motifs are the most important features that discriminate scenarios in both high and medium diversity. In the high diversity scenarios, there are a higher number of important features that equally contribute to the classification d, as compared with the medium diversity scenarios b. The classifiers shown in this figure are built with the top 10% edge weights of the repertoire similarity matrices

