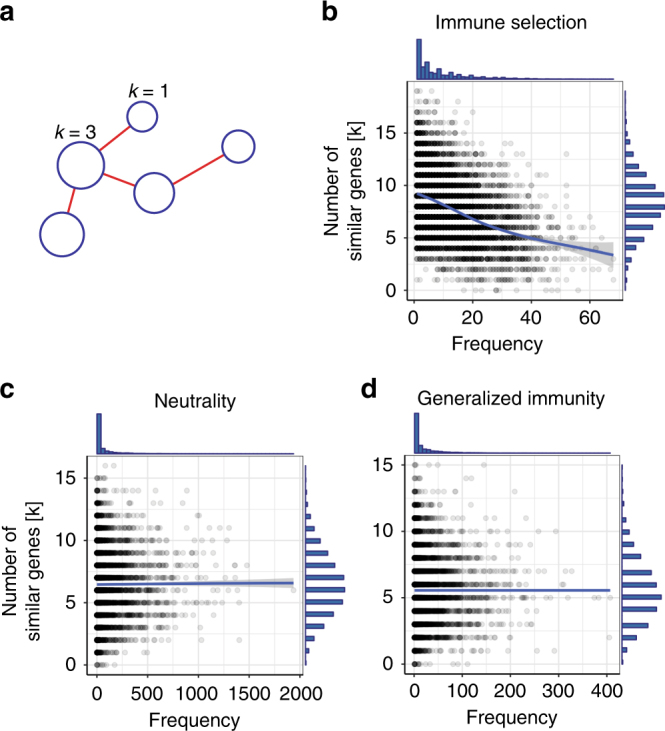
Fig. 4.

The relationship between gene frequencies and number of genes similar to a focal gene is different between selection and null models. a In a gene similarity network, each node represents a unique gene circulating in the population and the edges encode the sharing of at least one allele between genes. The size of the node is proportional to its frequency in the population and the node degree k depicts the number of genes that share at least one allele with the focal gene. There is a negative correlation between a gene’s frequency and degree in the immune selection scenario (b, r = −0.412, t-test: p-value < 2.2e – 16), but not in the complete neutrality (c, r = 0.016, t-test: p-value = 0.17) or generalized immunity (d, r = − 0.002, t-test: p-value = 0.89) scenarios. G = 24,000, b = 0.5, D = 1 year
